

[ad_1]
Welcome to the ORATS earnings report where we scan for companies with upcoming earnings announcements, check out historical earnings information, and find a potential options trade.
Read on or watch the video overview here: https://youtu.be/dEO4Dzx_4oE.
Let’s start by running a scan on stocks reporting earnings this week, which includes the total option volume indicator, sorted from greatest to least.
Focusing on Apple, as we click through, we see this large-cap company in the consumer electronics industry reports earnings on Thursday, October 27th, after the close.
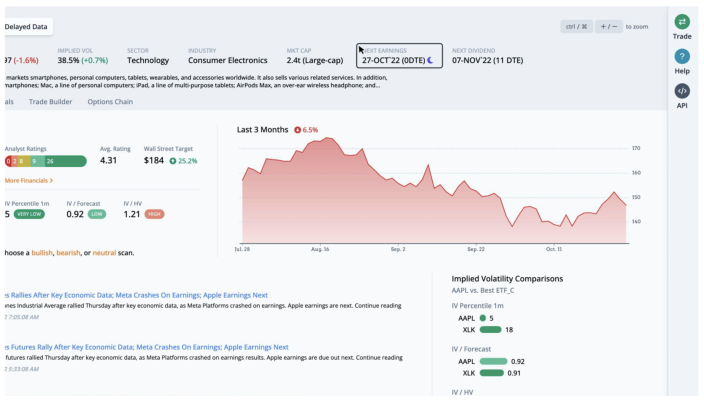
The earnings and financials tab takes us to more detail showing the options market expecting a move of 4.7% in either direction. This move was breached in 3 out of the last 12 earnings.
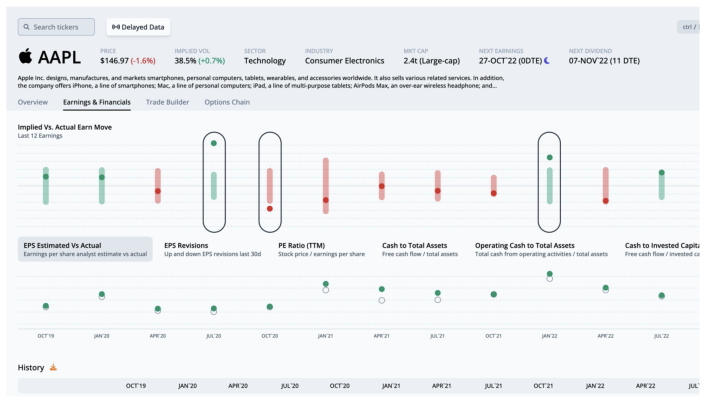
During that time, the post-earnings move was outside of the implied range 3 times. In those cases, long straddles were profitable. The rest of the earnings moves likely yielded profitable short straddles. We can overlay quarterly financial data by clicking on the ratios below the earn move graph. Let’s look at the PE ratio, which is the stock price divided by the trailing twelve months earnings per share.
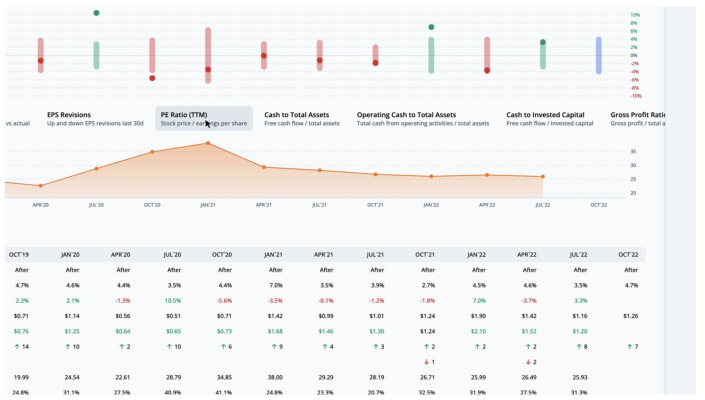
For AAPL, the current PE ratio is 24.3, which is 12.2% under the average for the last twelve earnings observations. Returning to the overview tab, we can quickly run a scan to find the best option trades. Since earnings are right around the corner, we scan for neutral strategies, then filter the scan results by S%, or smoothed edge, by setting it between negative and positive 3%.
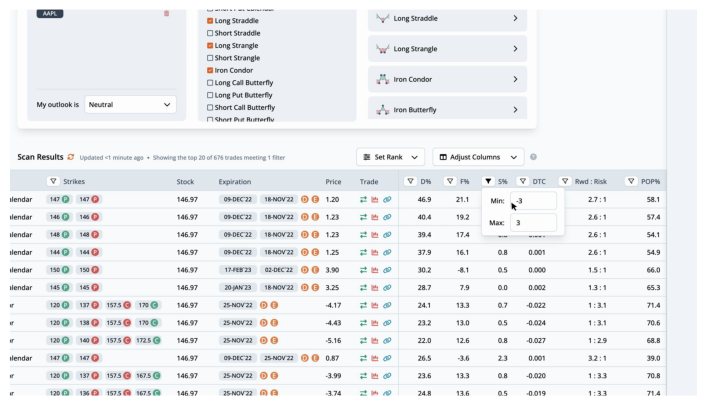
This helps narrow the results to trades that are fairly priced. The highest ranked trade is a LongPutCalendar with strikes at 147, expiring on Friday, December 9th and Friday, November 18th, for a debit of $1.2.
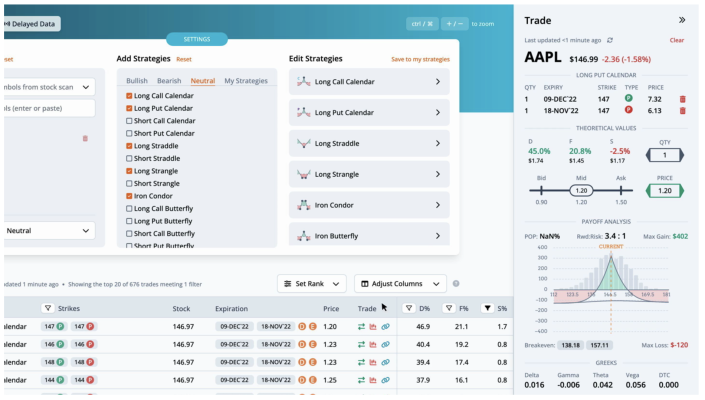
By pulling up the trade, we can see the theoretical values in more detail. The distribution edge, found by the expected value of the payoff picture on the stock’s historical distribution, has an edge of 45.0%. The forecast edge, which is derived from historical volatility, has an edge of 20.8%. Lastly, the smoothed edge, which is calculated by drawing a best fit curve through the monthly implied volatilities, has an edge of -2.5%. The edge is relative to the mid-market price of the trade. Greater positive edges are a theoretical benefit to the trader. We can also look at the payoff graph. The reward to risk divides the max gain by the max loss. Here the 3.4 to 1 is the ratio of the max gain of $402 to the max loss of $-120. There are two break evens for this LongPutCalendar at 138.18 and 157.11. The total greeks and ThinkOrSwim code complete the information on the trade analysis popout.
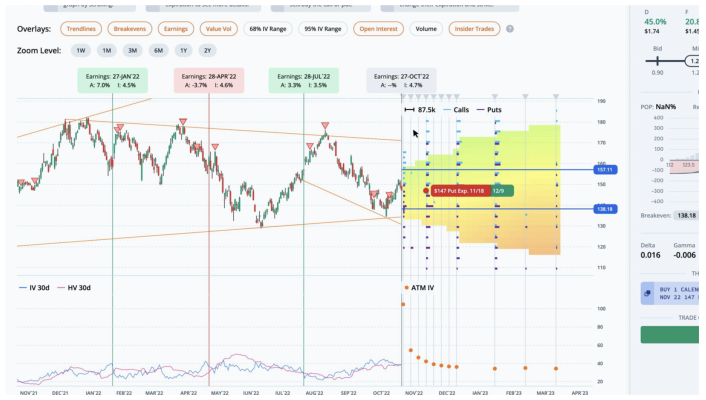
Next, let’s look at this trade in the trade builder. Over the last month, the stock price fell 1.9%, while the thirty-day implied volatility fell 1.2%. The average slope of the trendlines is negative. The heatmap on the right side of the graph is green where volatility and slope are undervalued, and red where they are overvalued. In this case, short term IV and slope are neutral, while the long term is slightly overvalued.
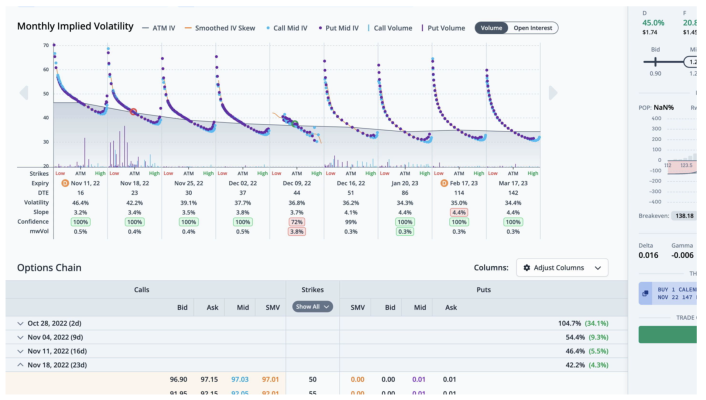
We can also see this trade overlaid on the monthly implied volatility graph in the chain tab. The legs for this trade are circled.
For any questions or issues with the article, please contact otto@orats.com. To subscribe to the dashboard, please visit https://orats.com/dashboard
Disclaimer:
The opinions and ideas presented herein are for informational and educational purposes only and should not be construed to represent trading or investment advice tailored to your investment objectives. You should not rely solely on any content herein and we strongly encourage you to discuss any trades or investments with your broker or investment adviser, prior to execution. None of the information contained herein constitutes a recommendation that any particular security, portfolio, transaction, or investment strategy is suitable for any specific person. Option trading and investing involves risk and is not suitable for all investors.
The views and opinions expressed herein are the views and opinions of the author and do not necessarily reflect those of Nasdaq, Inc.
[ad_2]
Image and article originally from www.nasdaq.com. Read the original article here.