

[ad_1]
Australian Dollar, AUD/USD, US Dollar, AU Trade Balance, Technical Outlook – Talking Points
- Market sentiment remains fragile as equity traders search for direction
- Australia’s trade balance data is in focus as stronger US Dollar bites
- AUD/USD Bear Flag signals concern for another potential leg lower
Thursday’s Asia-Pacific Outlook
A US Dollar rebound may temper risk-taking in today’s Asia-Pacific markets. US stock indexes saw volatile trading overnight when the S&P 500 and Dow Jones Industrial Average climbed into the green after a deeply negative opening. However, bulls couldn’t hold those gains, and the S&P 500 and DJI closed 0.20% and 0.14% lower, respectively. Still, it was an impressive showing, but enthusiasm around a Fed pivot remains murky at best. The Federal Reserve’s Mary Daly—a usual dove—stated that more rate increases are needed.
Gold and silver prices fell, with the white metal far outpacing the yellow’s losses, falling around 0.5% and 2%. That pushed the gold/silver ratio back above the 82 level and its 200-week Simple Moving Average (SMA). Copper prices were slightly higher despite a stronger US Dollar. The Atlanta Fed’s GDPNow Q3 forecast rose to 2.7% from 2.3%, indicating improved odds for a soft landing, which bodes well for the industrial metal.
Discover what kind of forex trader you are
Cotton prices closed at the lowest level since July 2021 in Chicago after falling over 5% against the stronger US Dollar and waning export demand. Lean hog futures surged over 4%, bringing prices off a multi-month low earlier this week as traders start to price in thinning US herd numbers. Coffee prices rose for a second day, and palm oil prices gained over 3%.
NZD/USD managed to rise around 0.5% throughout EU and US trading hours after the RBNZ delivered a hawkish hike, with the policy statement showing that there were considerations for a larger 75-bps hike stating: “The Committee considered whether to increase the OCR by 50 or 75 basis points at this meeting. Some members highlighted that a larger increase in the OCR now would reduce the likelihood of a higher peak in the OCR being required.” AUD/NZD is tracking toward a third daily loss.
Today brings several data prints, with Australia’s August trade balance offering the headline event, although it may not move markets in a meaningful way. However, Australia’s exports act as a decent proxy for China’s commodities demand. Analysts expect the trade balance to increase to A$10.1 billion from A$8.73 billion. Hong Kong’s September PMI is also due at the same time (00:30 UTC).
Recommended by Thomas Westwater
Get Your Free AUD Forecast
Australian Dollar Technical Outlook
A Bear Flag formation suggests that prices may make another leg lower if flag support breaks, which would open the door for prices to follow the preceding downtrend. The Relative Strength Index (RSI) is losing upward momentum, stalling short of the 50 CenterPoint.
AUD/USD 8-Hour Chart
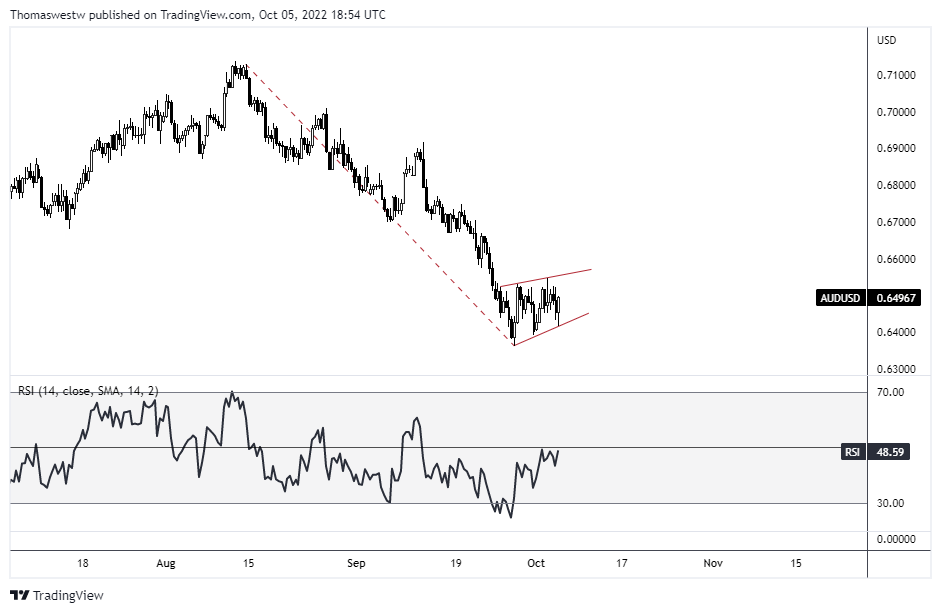
Chart created with TradingView
— Written by Thomas Westwater, Analyst for DailyFX.com
To contact Thomas, use the comments section below or @FxWestwater on Twitter
[ad_2]
Image and article originally from www.dailyfx.com. Read the original article here.