
[ad_1]
Today, we are going to look at a bearish put calendar spread on TSLA.
This strategy is one that you can use when you think a stock price is going to go down.
As the price goes down, implied volatility usually goes up.
The calendar, being a long vega trade, benefits when implied volatility increases.
The trick is to get the calendar on before the volatility increase.
If you initiate the calendar too late after volatility has increased, that would not be ideal because volatility is likely to drop back to normal, which is not good for calendar trade.
Contents
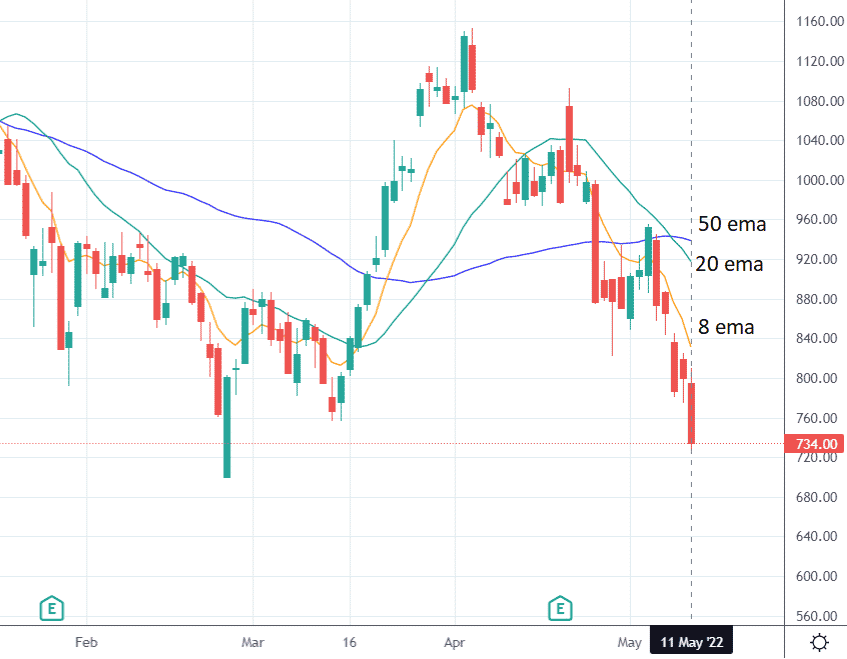
On May 11, 2022, Telsa (TSLA) is in a downtrend, as noted by the price being below the 8 exponential moving average (EMA).
And the 8 EMA is below the 20 EMA, which in turn is below the 50 EMA.
Some traders might like to use another indicator to further confirm the trend.
Take RSI, for example.
TSLA’s RSI is quite low at 30.
Anything under 50 is bearish.
How about the ADX indicator.
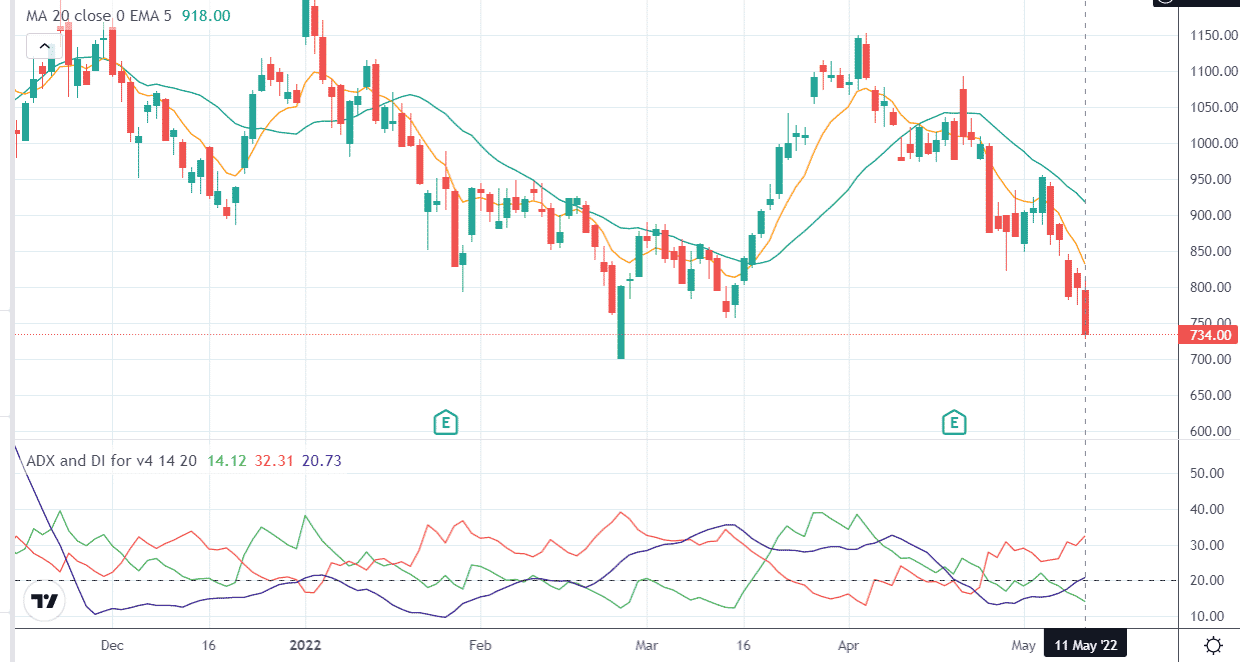
The ADX indicator (black line) is crossing above 20, indicating a trend taking place.
The red line is above the green line, indicating that the trend is bearish.
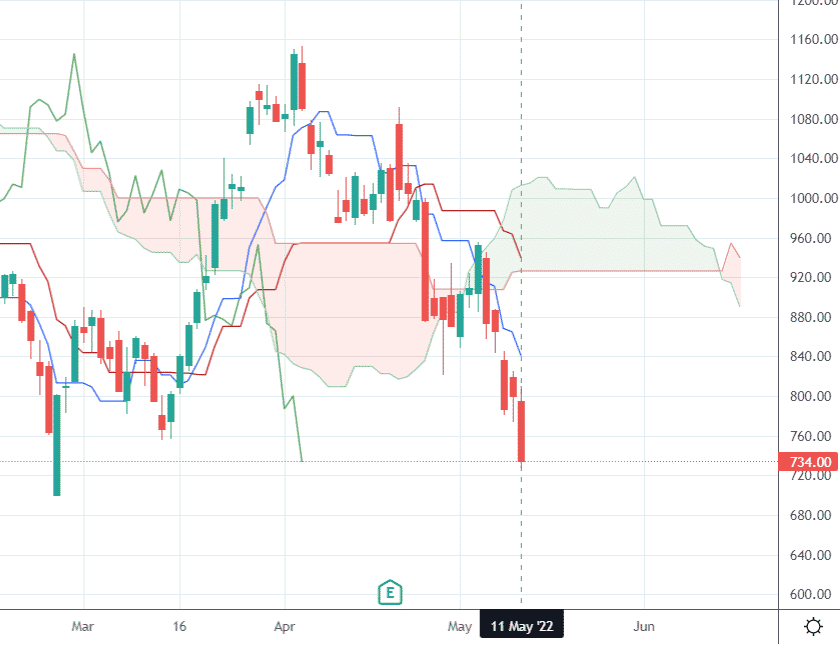
Or perhaps the Ichimoku cloud indicator.
Price is below the cloud.
Plus, the conversion line is below the baseline.
With so many indicators indicating a bearish move in TSLA, the following bearish calendar make sense.
Date: May 11, 2022
Sell one Jun 17 TSLA $650 put @ $41.42
Buy one Jul 15 TSLA $650 put @ $58.54
Debit: $1712
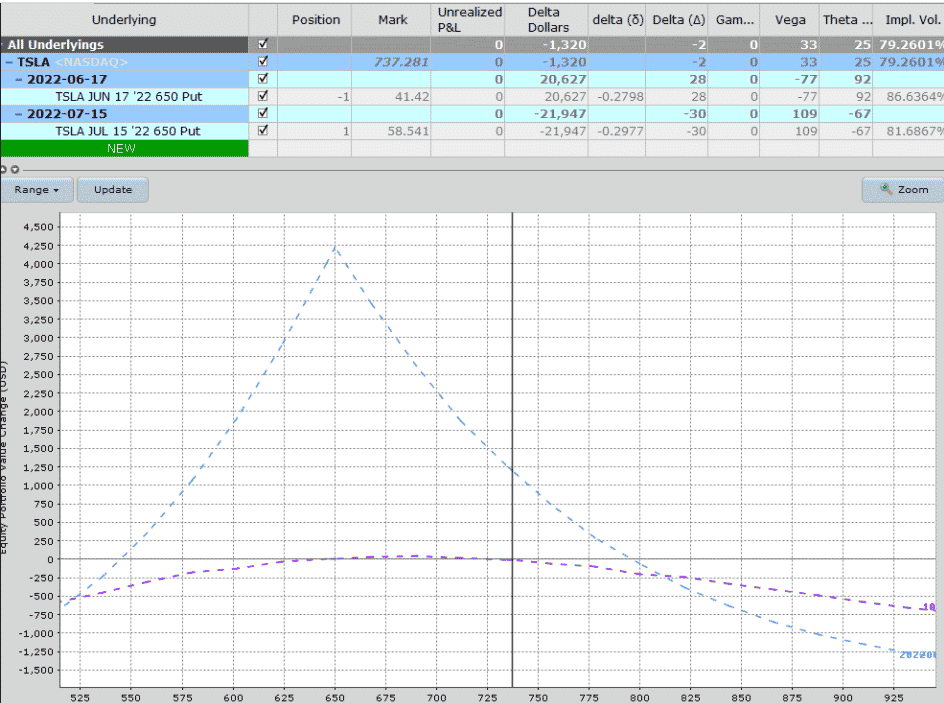
We are selling the $650 put option with expiration one month away.
And we are buying a $650 put option another month out from that.
We picked $650, thinking that the price would head in that direction and ideally end up at $650 in about a month’s time.
Note also that the short put has an implied volatility of 86.6 while the long put has an implied volatility of 81.6.
Under normal conditions, the further out long put should have higher volatility than the shorter-dated put.
But here we have the opposite.
This is in our favor because now we are selling an option with high implied volatility and buying an option with lower implied volatility.
Think of a high implied volatility option as an expensive option and a low implied volatility option as less expensive.
We are selling high and buying low.
An option with high implied volatility has more extrinsic value than an option with a low implied volatility of the same strike and expiration.
With more extrinsic value, it has more to drop because extrinsic value must go to zero at expiration.
So it is good that we are selling options with high extrinsic value.
Why is it that, in this case, we have the short-dated option with higher implied volatility than the long-dated option?
Sometimes we see this caused by an earning event. But in this case, there was none.
However, the VIX term structure on that day was in backwardation.
This most likely would cause many short-term options to be in greater demand and have higher implied volatility than normal.
This backwardation would not be ideal for delta-neutral range-bound trades such as at-the-money calendars.
But for a bearish directional trade, it may actually work in our favor.
We normally don’t hold calendars to expiration.
Two weeks later, on May 25, we see that the price of TSLA is at $657, which is quite close to the calendar peak at $650.
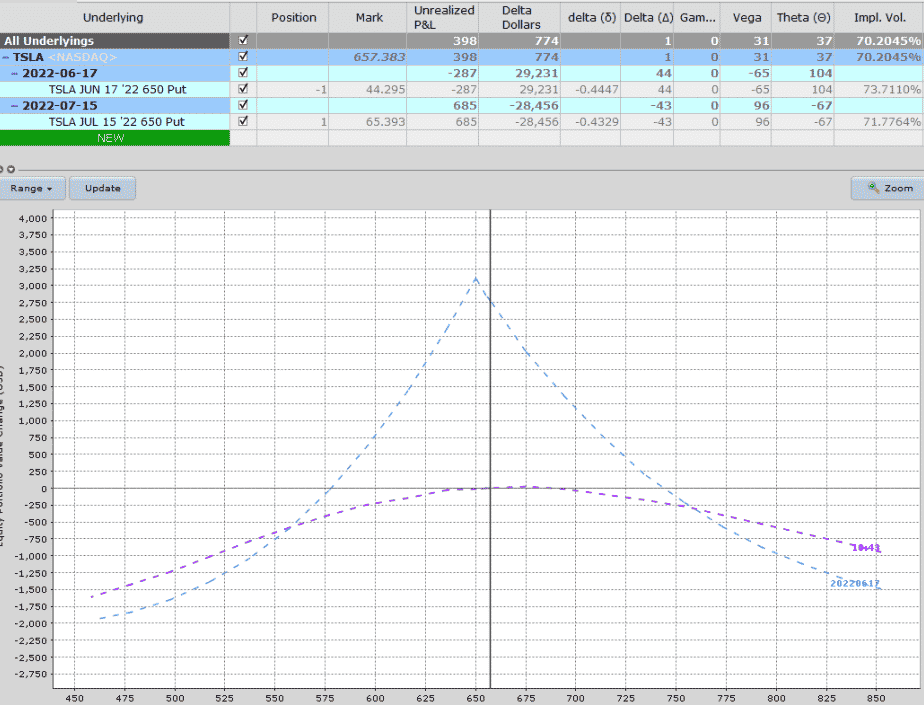
The P&L is showing $398.
This is a good time to take the profit.
The return yield on the trade would be $398/$1712 = 23%
How are the break-evens of a calendar calculated?
The expiration break-even points are only estimates.
There is one break-even point to the right of the strike price and one break-even point to the left of the strike price.
It is when the expiration curve crosses the zero P&L horizontal.
These points change when the max potential profit peak moves up or down as implied volatilities change throughout the trade.
How is the max risk of a calendar calculated?
The max risk in a calendar trade is the debit you initially paid to initiate the calendar trade.
You can lose the entire amount, but you can not lose more.
Does my max risk of the calendar change?
No, the max risk of a calendar does not change.
The max potential profit and the break-even points change as implied volatility changes.
But the max risk is always the debit paid for the calendar.
What volatility level is the best for calendars?
For non-directional at-the-money calendars, they are typically used when VIX is 20 or below.
Putting on a calendar at the low end of the volatility range means there is a greater chance that volatility will increase back to the mean.
An increase in implied volatility is good for calendars.
But for directional calendars such as bearish put calendars, you can put them on in any volatility.
Getting the direction correct is more important.
In a bearish calendar, if you get the direction correct and the price goes down, volatility will likely increase as well.
The bearish put calendar spread should be among the many options strategies to be considered when trying to capitalize on a potential downward movement in the underlying asset price.
It has a high reward-to-risk ratio.
The debit paid for the calendar is the maximum risk in the trade.
As long as the strikes are not too far away from the current price, the trade has positive theta, which means that time decay is working in our favor.
Trade safe!
Disclaimer: The information above is for educational purposes only and should not be treated as investment advice. The strategy presented would not be suitable for investors who are not familiar with exchange traded options. Any readers interested in this strategy should do their own research and seek advice from a licensed financial adviser.

[ad_2]
Image and article originally from optionstradingiq.com. Read the original article here.