

[ad_1]
Crude Oil Price Talking Points
The price of oil fails to defend the August low ($85.73) as it carves a fresh series of lower highs and lows, and crude may attempt to test the January low ($74.27) as it appears to be tracking the negative slope in the 50-Day SMA ($93.87).
Crude Oil Price Outlook Mired by Failure to Defend August Low
The price of oil trades to a fresh monthly low ($81.20) after snapping the opening range for September, and it seems as though the recent decision by the Organization of Petroleum Exporting Countries (OPEC) to no longer boost production will do little to shore up crude prices amid the weakening outlook for energy demand.
Data prints coming out of the US point to slowing consumption as crude inventories unexpectedly increase for the first time in four weeks, with stockpiles jumping 8.844M in the week ending September 2 versus forecasts for a 0.25M decline.
The development may provide OPEC with greater scope to scale back production as the group emphasizes the “need to support the market’s stability and its efficient functioning,” and the organization may continue to adjust its output schedule at the next Ministerial Meeting on October 5 as the most recent Monthly Oil Market Report (MOMR) warns that “for 2022, world oil demand is foreseen to rise by 3.1 mb/d, a downward revision of 0.3 mb/d from last month’s estimate.”
Until then, the price of oil may face headwinds as OPEC appears to be changing gears, but signs of limited supply may curb the downside risk for crude as US production remains below pre-pandemic levels.
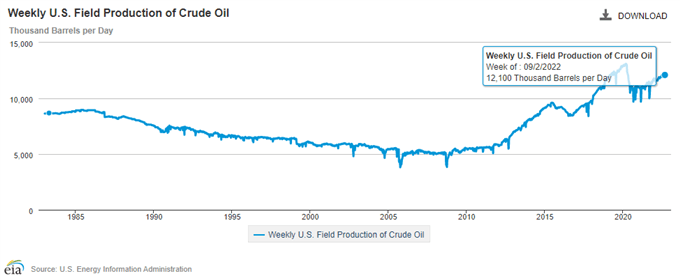
A deeper look at the figures from the Energy Information Administration (EIA) show weekly field production printing at 12,100K for the second week, and it remains to be seen if the development will sway OPEC as the group seems to be adapting to the weakening outlook for energy demand.
With that said, failure to defend the defend the August low ($85.73) may lead to a further decline in the price of oil as it extends the series of lower highs and lows from earlier this week, and crude may attempt to test the January low ($74.27) as it appears to be tracking the negative slope in the 50-Day SMA ($93.87).
Crude Oil Price Daily Chart
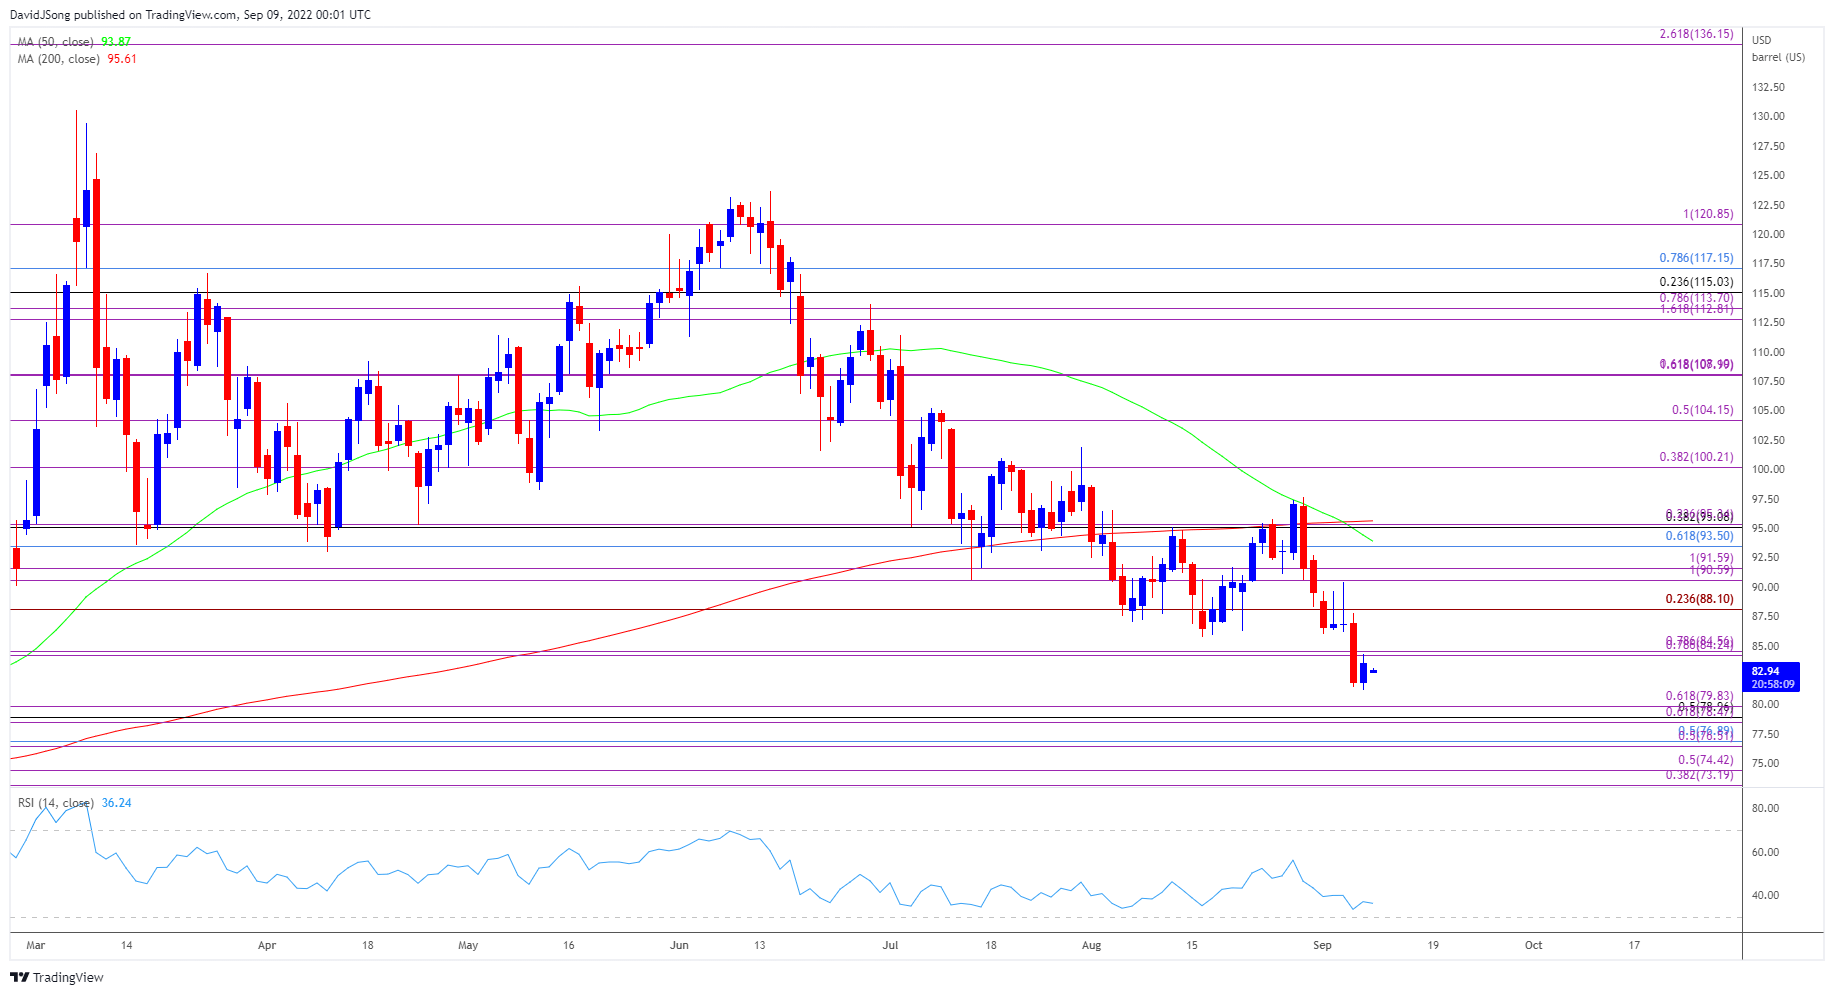
Source: Trading View
- The price of oil snaps opening range for September as it slips to a fresh monthly low ($81.20), with the recent series of lower highs and lows bringing the Fibonacci overlap around $78.50 (61.8% expansion) to $79.80 (61.8% expansion) on the radar.
- Next area of interest comes in around $76.50 (50% retracement) to $76.90 (50% retracement), with a break below theJanuary low ($74.27) opening up the $73.20 (38.2% expansion) to $74.40 (50% expansion) region.
- However, failure to test the overlap around $78.50 (61.8% expansion) to $79.80 (61.8% expansion) may push the price of oil back towards the $84.20 (78.6% expansion) to $84.60 (78.6% expansion) region, with a move above $88.10 (23.6% expansion) bringing the monthly high ($90.39) back on the radar.
Recommended by David Song
Traits of Successful Traders
— Written by David Song, Currency Strategist
Follow me on Twitter at @DavidJSong
[ad_2]
Image and article originally from www.dailyfx.com. Read the original article here.