

[ad_1]
NicoElNino
Equity funds (including ETFs), taxable bond funds, and municipal bond funds took it on their collective chins this week after Federal Reserve Board Chair Jerome Powell made very clear his intent to attack inflation head on during his remarks at the Fed’s annual Jackson Hole symposium.
In his remarks, Powell’s hawkish comments dashed any hopes for a less aggressive monetary policy, stating the central bank will continue its battle against inflation “until the job is done,” even if that causes near-term economic pain to households and businesses.
On August 26, the Dow Jones Industrial Average and the S&P 500 index suffered their largest one-day percentage declines since May 16 and June 13, respectively, after Powell’s remarks.
For the Refinitiv Lipper fund flows week ended August 31, 2022, the U.S. broad market indices saw four consecutive down days – contributing to the DJIA and S&P 500 August monthly declines of 4.06% and 4.24%.
For the fund flows week, the average equity fund suffered a market loss of 3.79%, while the average taxable and tax-exempt bond funds declined 0.81% and 0.48%, respectively.
Only a handful of equity classifications managed to post plus-side returns for the week, with – as might be expected – Dedicated Short Bias Funds (+11.25%) posting the strongest returns, followed at a distance by Alternative Managed Futures Funds (+1.05%) and India Region Funds (+0.86%).
Equity Leverage Funds (-11.62%) suffered the largest market declines for the week, bettered by Precious Metals Equity Funds (-10.87%), Science & Technology Funds (-8.16%), and Basic Materials Funds (-8.08%).
For the fund flows week, the 10-year Treasury yield rose 15 basis points (bps), settling at 3.15%, while the two-year Treasury yield rose 10 bps to 3.45%, leaving the two- and 10-year Treasury yield spread (30 bps) inverted, often considered a sign of a potential recession. An inverted Treasury yield curve has preceded the past eight recessions while signaling two false positives with an inversion in late 1966 and a flat curve in late 1998.
On the taxable bond fund (including ETFs) side – ignoring money market funds and Ultra-Short Obligation Funds – Short U.S. Treasury Funds (-0.23%) did the best job mitigating losses for the week, followed closely by the inverse and/or short biased Specialty Fixed Income Funds (-0.27%) classification.
At the other end of the spectrum, High Yield Funds (-2.37%) suffered the largest market declines of the asset class, bettered by Inflation Protected Bond Funds (-2.08%), Corporate Debt BBB-Rated Funds (-2.03%), and Global High Yield Funds (-2.02%).
With all that in mind, it was not surprising to see investors were overall net redeemers of fund assets (including those of conventional funds and ETFs) for the first week in three, removing a net $30.2 billion – their largest weekly net outflows since June 15, 2022.
Fund investors were net redeemers of equity funds (-$10.6 billion), taxable bond funds (-$9.2 billion), money market funds (-$6.9 billion), and tax-exempt fixed income funds (-$3.4 billion) for the week.
Nonetheless, a few of the macro groups within the broad asset classes were still able to attract net new money. On the equity side, equity income funds (including conventional funds and ETFs) took in the largest amount of net new money, attracting $1.4 billion for the week, followed by sector-finance/banking funds (+$955 million), convertible & preferred stock funds (+$141 million), and sector utilities funds (+$61 million), while large-cap funds (-$8.6 billion) and mid-cap funds (-$908 million) were the pariahs.
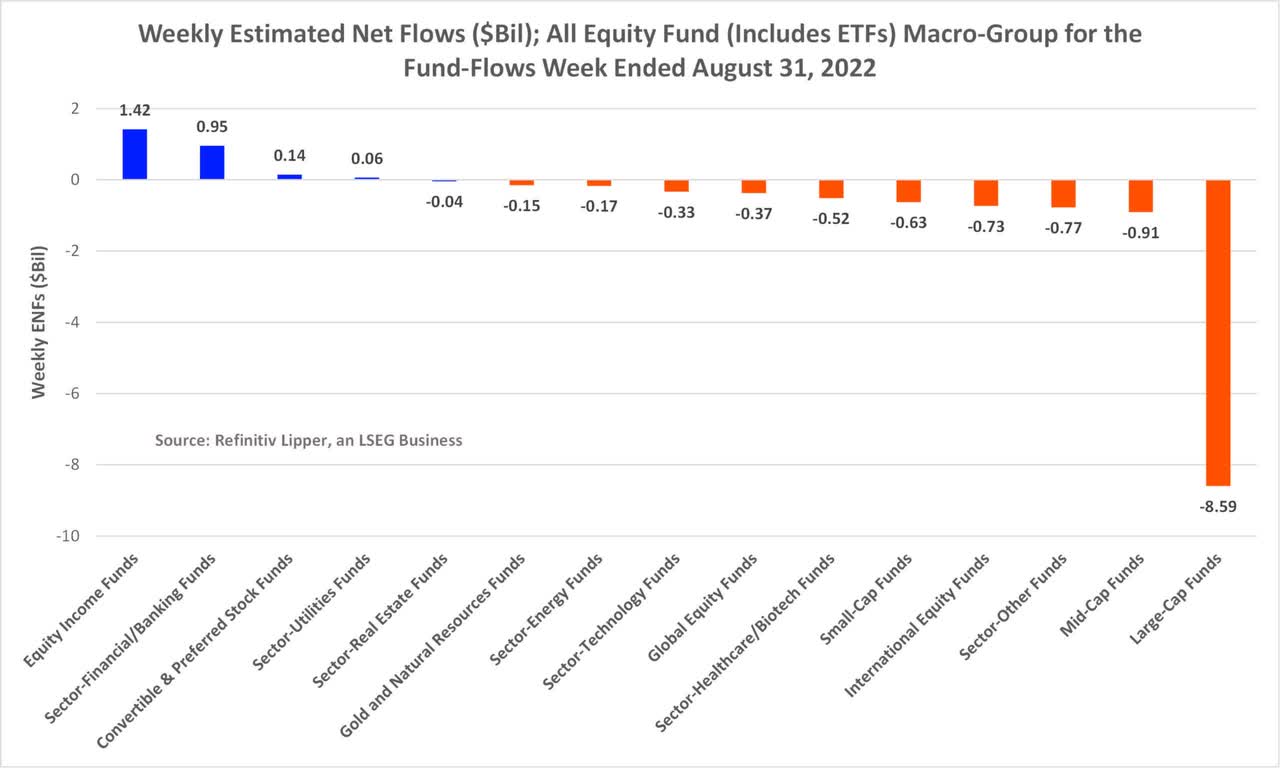
Financial Select Sector SPDR Fund (XLF, $978 million), Oakmark Fund, R6 Shares (OAZMX, +$741 million), and USAA NASDAQ 100 Index, Institutional Shares (UINQX, +$527 million) took in the largest individual net flows for the week. Meanwhile, SPDR S&P 500 (SPY, -$4.8 billion) and Invesco QQQ Trust 1 (QQQ, -$1.1 billion) suffered the largest individual fund net redemptions.
On the taxable bond funds side, government Treasury funds (including ETFs) took in the largest draw of net new money, attracting $3.1 billion, while corporate high-quality funds (+$3 million) attracted the only other net inflows for the week.
At the classification level, Short U.S. Treasury Funds (+$2.1 billion) attracted the lion’s share of inflows, followed by General U.S. Treasury Funds (+$945 million) and Ultra-Short Obligation Funds (+$440 million).
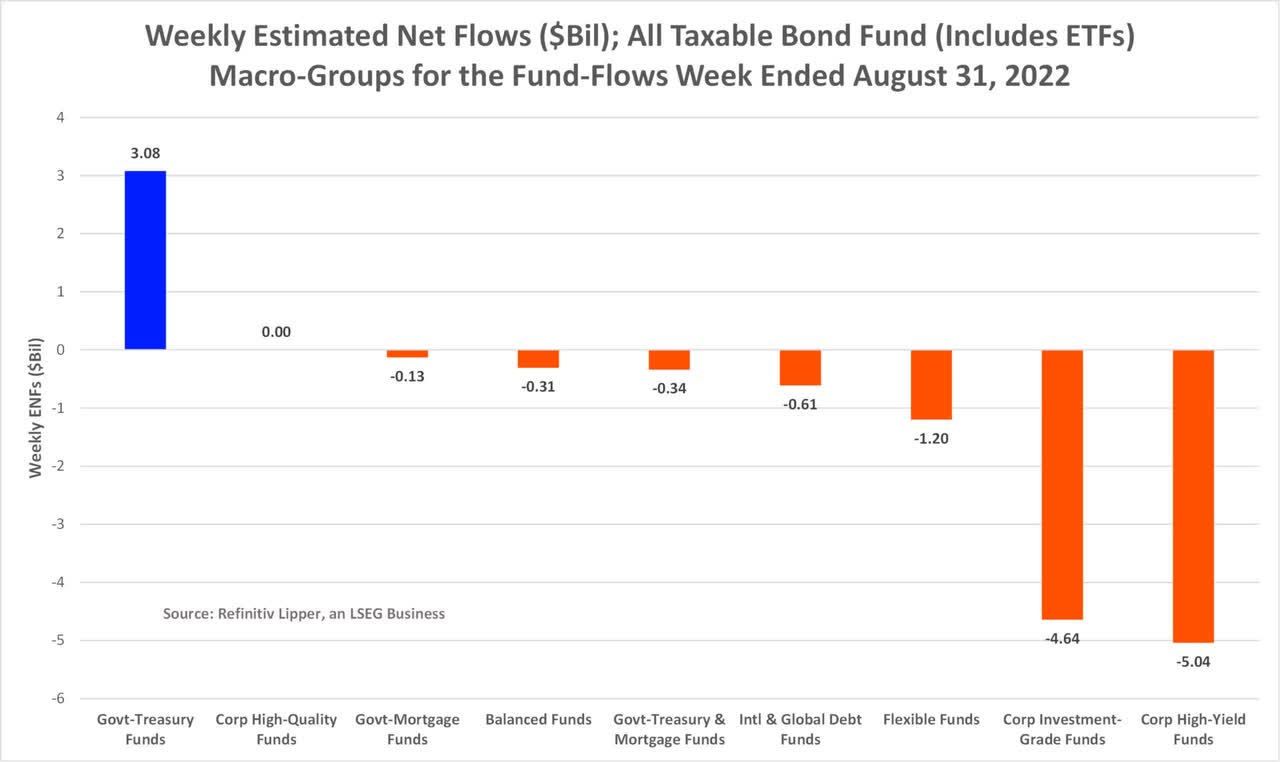
The primary attractor of investors’ assets in the taxable bond fund macro-group were SPDR Bloomberg 1-3 Month T-Bill ETF (BIL, +$1.1 billion), iShares 20+ Year Treasury Bond ETF (TLT, +$1.0 billion), and JPMorgan Ultra-Short Income ETF (JPST, +$696 million), while iShares iBoxx $ High Yield Corporate Bond ETF (HYG, -$1.2 billion) and iShares iBoxx $ Investment Grade Corporate Bond ETF (LQD, -$723 million) handed back the largest individual net redemptions for the week.
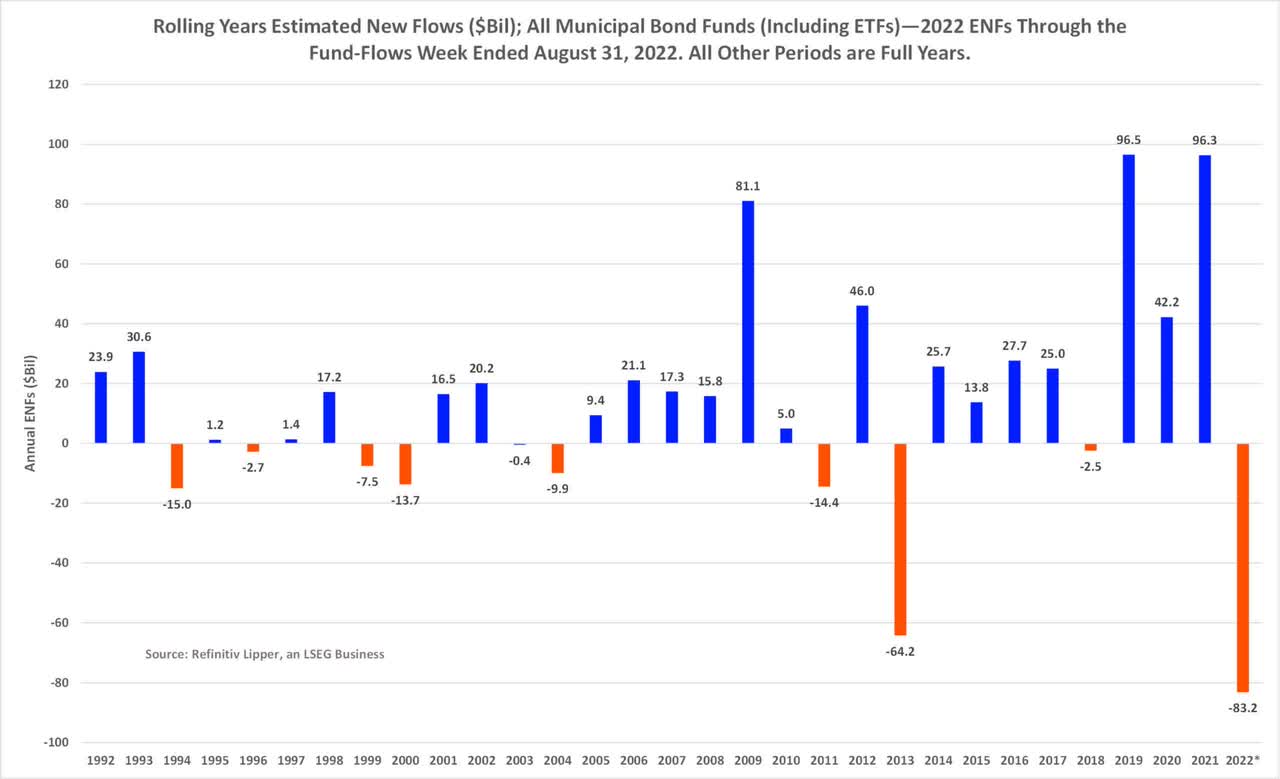
Municipal bond funds (including ETFs) witnessed their eighth largest weekly net redemptions on record, dating back to 1992 when Lipper began tracking weekly flows, extending their losing streak to the fourth consecutive week and handing back a net $3.4 billion for the current fund flows week.
Year to date, the municipal bond funds macro group handed back $83.2 billion – witnessing the largest net redemption thus far of any full year dating back to 1992 when Lipper began calculating weekly estimated net flows.
Editor’s Note: The summary bullets for this article were chosen by Seeking Alpha editors.
[ad_2]
Image and article originally from seekingalpha.com. Read the original article here.