

[ad_1]
roberthyrons/iStock via Getty Images
This dividend ETF article series aims at evaluating products regarding the relative past performance of their strategies and quality metrics of their current portfolios. Holdings and weights change over time, so updated reviews are posted when necessary.
DHS strategy and portfolio
The WisdomTree U.S. High Dividend Fund (NYSEARCA:NYSEARCA:DHS) has been tracking the WisdomTree U.S. High Dividend Index since 06/16/2006. DHS has 311 holdings, a distribution yield of 4.18% and an expense ratio of 0.38%. DHS pays monthly distributions
As described on WisdomTree website:
The index is dividend weighted annually to reflect the proportionate share of the aggregate cash dividends each component company is projected to pay in the coming year, based on the most recently declared dividend per share and adjusted for a company’s composite risk score. Composite risk score is an average of three factors: value, quality and momentum.
DHS invests exclusively in U.S. companies, mostly in large and mega caps (76%).
The portfolio is quite concentrated: The top 10 holdings, listed below with some basic ratios, have an aggregate weight of 45%.
|
Ticker |
Name |
Weight |
EPS Growth % |
P/E ttm |
P/E fwd |
Yield % |
|
Exxon Mobil Corp. |
7.90% |
393.29 |
10.54 |
7.60 |
3.65 |
|
|
Chevron Corp. |
5.45% |
703.62 |
10.69 |
8.53 |
3.55 |
|
|
The Coca-Cola Co. |
4.82% |
17.92 |
28.33 |
25.33 |
2.82 |
|
|
Philip Morris International Inc. |
4.80% |
2.58 |
16.67 |
17.29 |
5.15 |
|
|
Pfizer Inc. |
4.68% |
118.65 |
9.37 |
7.36 |
3.34 |
|
|
AbbVie Inc. |
4.52% |
90.35 |
20.01 |
10.21 |
3.99 |
|
|
Altria Group, Inc. |
3.95% |
-60.24 |
46.84 |
9.43 |
8.25 |
|
|
Verizon Communications Inc. |
3.42% |
3.20 |
8.48 |
8.14 |
6.18 |
|
|
Merck & Co., Inc. |
3.27% |
198.27 |
13.37 |
11.83 |
3.16 |
|
|
Devon Energy Corp. |
2.13% |
4028.60 |
8.72 |
7.33 |
5.90 |
The fund is well-balanced in the top 5 sectors: Energy, healthcare, consumer staples, financials and utilities weigh between 13.1% and 20.3% of asset value. Other sectors are below 5% individually and 17% in aggregate. Compared to the S&P 500 (SPY), DHS overweights these top 5 sectors and also real estate. It massively underweights technology, consumer discretionary, communication and industrials. Sector composition may change over time.
Sector weights (chart: author; data: WisdomTree)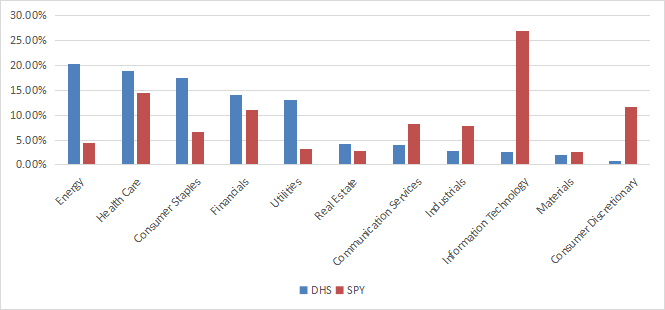
Valuation metrics are much cheaper than for the S&P 500, as reported in the next table.
|
DHS |
SPY |
|
|
Price/Earnings TTM |
13.52 |
19.63 |
|
Price/Book |
2.32 |
3.72 |
|
Price/Sales |
1.76 |
2.4 |
|
Price/Cash Flow |
9.08 |
14.98 |
Source: Fidelity
Past performance
In the last 10 years, DHS has underperformed the S&P 500 and the Schwab U.S. Dividend Equity ETF (SCHD) by a wide margin in annualized return and risk-adjusted return (Sharpe ratio).
|
Trailing 10 Years |
Total Return |
Annual.Return |
Drawdown |
Sharpe Ratio |
Volatility |
|
DHS |
154.72% |
9.80% |
-35.41% |
0.73 |
12.94% |
|
SPY |
240.32% |
13.03% |
-32.05% |
0.89 |
14.10% |
|
SCHD |
248.43% |
13.30% |
-32.29% |
0.93 |
13.64% |
Data calculated with Portfolio123
However, DHS beats them year-to-date:
DHS, SPY and SCHD 2022 to date (Portfolio123)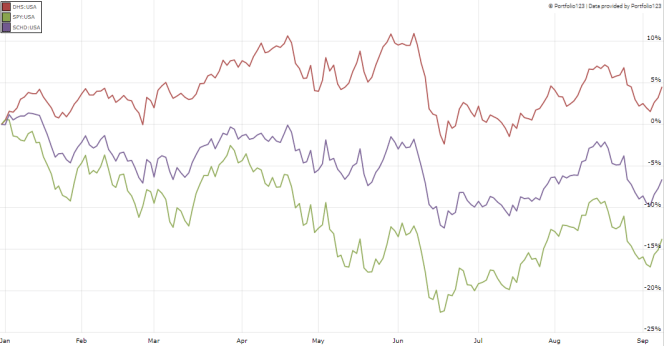
In previous articles, I have shown how three factors may help cut the risk in a dividend portfolio: Return on Assets, Piotroski F-score, and Altman Z-score.
The next table compares DHS with a subset of the S&P 500: Stocks with an above-average dividend yield, an above-average ROA, a good Altman Z-score, a good Piotroski F-score and a sustainable payout ratio. The subset is rebalanced annually to make it comparable with a passive index.
|
Trailing 10 Years |
Total Return |
Annual.Return |
Drawdown |
Sharpe Ratio |
Volatility |
|
DHS |
154.72% |
9.80% |
-35.41% |
0.73 |
12.94% |
|
Dividend & quality subset |
271.32% |
14.02% |
-37.07% |
0.94 |
14.43% |
Past performance is not a guarantee of future returns. Data Source: Portfolio123
DHS underperforms the dividend quality subset. However, the ETF performance is real, and this subset is hypothetical. My core portfolio holds 14 stocks selected in this subset (more info at the end of this post).
Scanning DHS with quality metrics
27 stocks out of 311 are risky regarding my metrics. These are companies with at least two red flags: Bad Piotroski score, negative ROA, unsustainable payout ratio, bad or dubious Altman Z-score, excluding financials and real estate for which these metrics are less reliable. Risky stocks weigh about 7% of the portfolio, which is acceptable.
According to my calculation of the weighted quality metrics reported in the next table, the Altman Z-score is inferior to the benchmark, but well above the high-risk threshold of 1.81. The Piotroski F-score and the ROA are a bit above the benchmark. My quality metrics point to a portfolio quality slightly superior to the S&P 500.
|
DHS |
SPY |
|
|
Altman Z-score |
2.5 |
3.4 |
|
Piotroski F-score |
6.2 |
6 |
|
ROA % TTM |
8.29 |
7.39 |
Takeaway
DHS holds over 311 dividend stocks, mostly large caps. Constituents are weighted based on dividend yield adjusted by a risk score taking into account technical and fundamental factors. The 3 heaviest sectors in the portfolio are energy, healthcare and consumer staples. DHS is more balanced than SPY across sectors. However, it is quite concentrated in the top 10 holdings (45%). Valuation ratios are much cheaper than for the benchmark, and quality is a bit superior. Past total return is underwhelming: DHS has lagged the benchmark and its competitor SCHD. However, it is in gain year-to-date, outperforming SPY and SCHD. For transparency, a dividend-oriented part of my equity investments is split between a passive ETF allocation and my actively managed Stability portfolio (14 stocks), disclosed and updated in Quantitative Risk & Value.
[ad_2]
Image and article originally from seekingalpha.com. Read the original article here.