

[ad_1]
imaginima
The ProShares Ultra Oil & Gas ETF (NYSEARCA:DIG) (the “Fund”) seeks daily investment results, before fees and expenses, that correspond to two times (2x) the daily performance of the Dow Jones U.S. Oil & GasSM Index (the “Index”). Holding periods greater than one day “can result in returns that are significantly different than the target return, and ProShares’ returns over periods other than one day will likely differ in amount and possibly direction from the target return for the same period. These effects may be more pronounced in funds with larger or inverse multiples and in funds with volatile benchmarks,” according to ProShares.
The Index is designed to measure the stock performance of U.S. companies in the oil and gas sector. Component companies typically are engaged in the following activities related to the oil and gas sector, among others, exploration and production, integrated oil and gas, oil equipment and services, pipelines, renewable energy equipment companies and alternative fuel producers.”
It is not possible to invest directly in an index. The purpose of the Fund is to provide investors with a financial product which matches the returns of the Index.
The exposures of the Index as of the end of June are listed below by weight. The largest sector by far (90.88%) is Oil & Gas and Consumable Fuels.
ProShares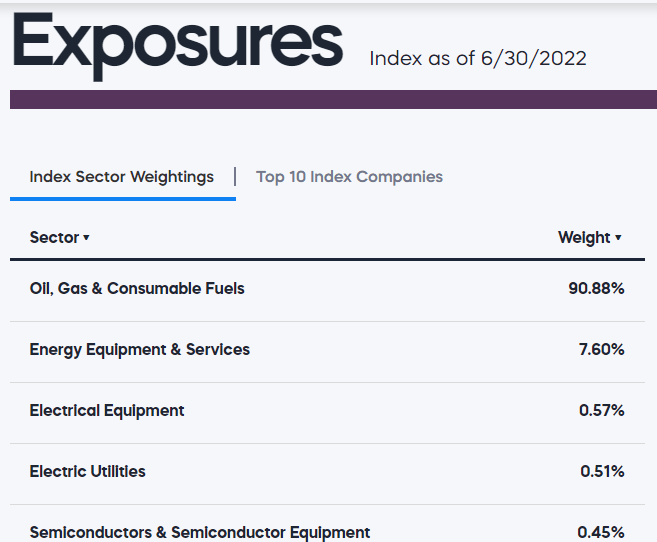
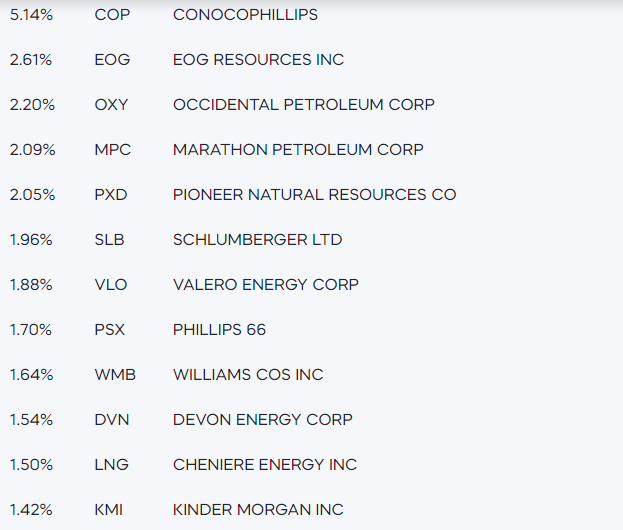
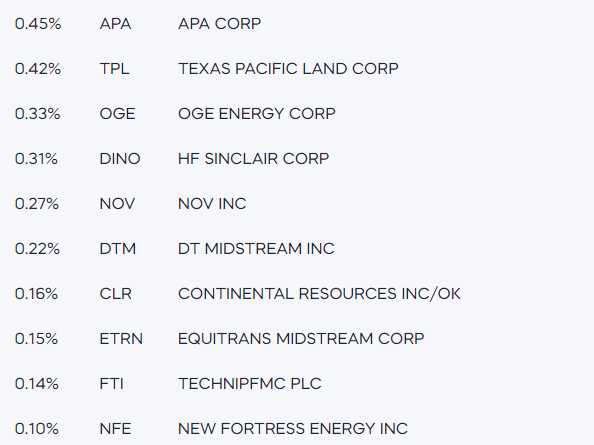
The specific holdings by weight are listed below. The largest holding (65.39%) is the DJ U.S. Oil and Gas Index Swap. ProShares defines a Swap as:
Contracts entered into primarily with major global financial institutions for a specified period ranging from a day to more than one year. In a standard “swap” transaction, two parties agree to exchange the return (or differentials in rates of return) earned or realized on particular predetermined investments or instruments. The gross return to be exchanged or “swapped” between the parties is calculated with respect to a “notional amount,” e.g., the return on or change in value of a particular dollar amount invested in a “basket” of securities or an ETF representing a particular index.”
ProShares
ProShares ProShares ProShares ProShares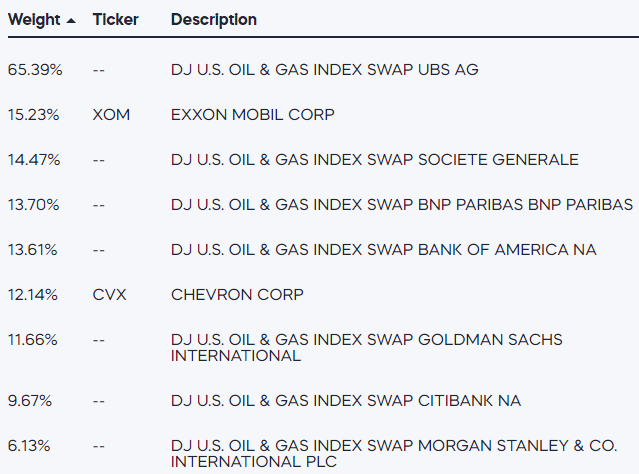

DIG has assets under management (“AUM”) of approximately $150 million and charges an Expense Ratio of 0.95%.
Seeking Alpha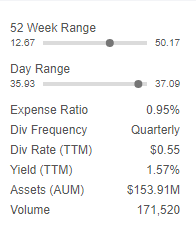
The operating expenses are further broken down in the table below.
ProShares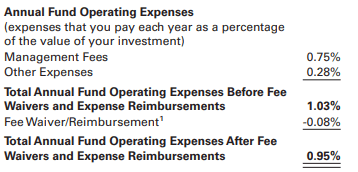
Seeking Alpha grades ETF Expenses and gave DIG an “F.”
Seeking Alpha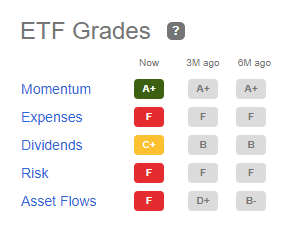
Principal Risks
ProShares provides a description of the risks of the Fund in its Prospectus.
Of particular note:
An investor in the Fund could potentially lose the full value of their investment within a single day.”
In addition:
For periods longer than a single day, the Fund will lose money if the Index’s performance is flat, and it is possible that the Fund will lose money even if the level of the Index rises. Longer holding periods, higher Index volatility, and greater leveraged exposure each exacerbate the impact of compounding on an investor’s returns. During periods of higher Index volatility, the volatility of the Index may affect the Fund’s return as much as or more than the return of the Index.”
Performance
The Fund commenced trading February 2, 2007. Since inception, the Fund has lost 43% of its value.
Yahoo Finance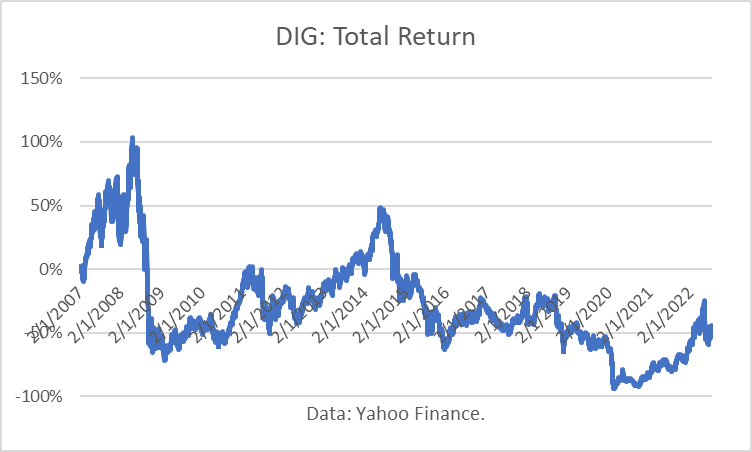
Moreover, the Fund experienced a Maximum Drawdown (“MD”) of 97% of its value. With such a large loss, the Fund is not suitable as a long-term investment.
Yahoo Finance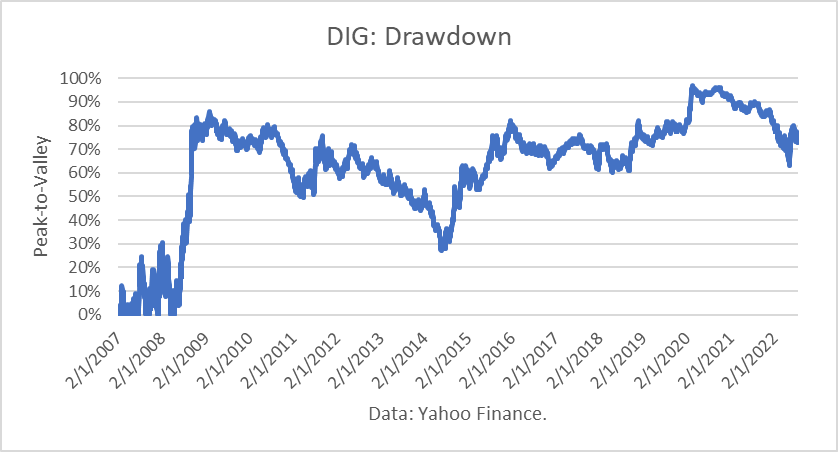
I compared the risk and return of DIG to that of the NYMEX WTI crude futures second nearby contract (“NYMEX”). In reality, the contract would have to be “rolled” each month, which involves selling a contract and buying the next one. However, the comparison is useful to view their relative differences.
The NYMEX return over the same period was +55% instead of the 43% loss in DIG.
NYMEX
The NYMEX MD was 92% over the same period, which is not quite as bad as an MD of 97%, but still far too high.
NYMEX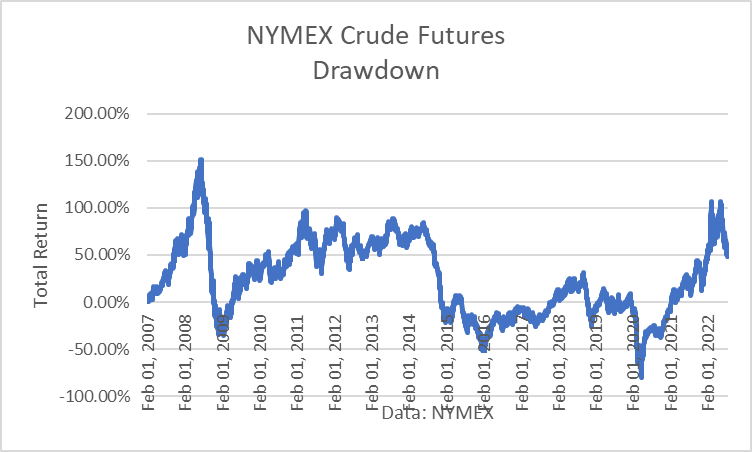
Finally, I looked at the DIG total return over the past year, when oil prices have soared. DIG provided a return of 190%, as compared to a loss of 3.37% in the SP500TR. During this relatively short period of strong oil prices, DIG performed very well.
Seeking Alpha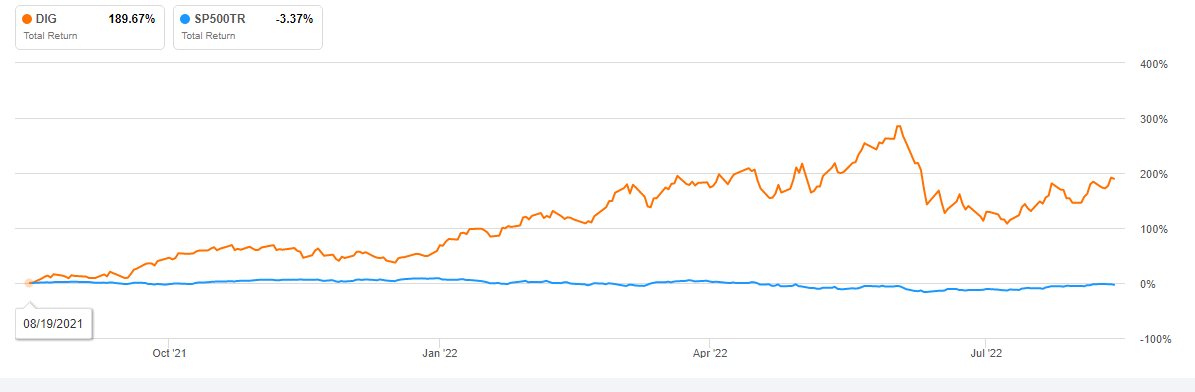
Conclusions
DIG is a leveraged financial product focused on the oil and gas sector. It is a very high risk product that should only be held by sophisticated investors, and then only for limited time periods. Under those conditions, it provides an opportunity for outsized returns. And so it is worth considering during such periods.
Looking forward, the NYMEX crude oil futures curve is backward-dated, meaning deferred contract prices progressively drop into the future.
NYMEX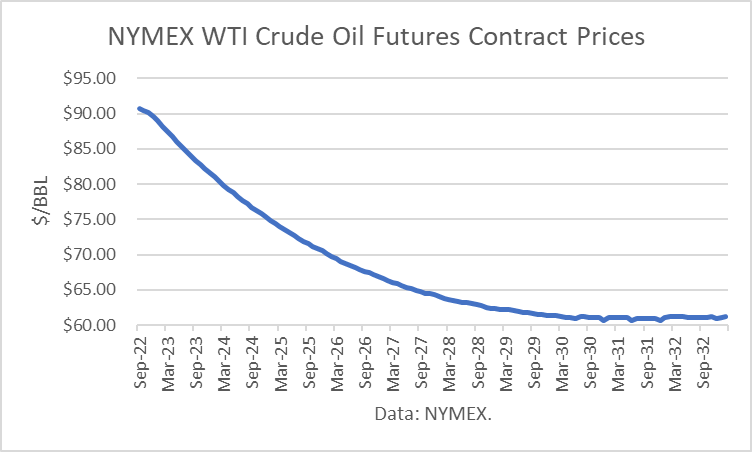
I also recently discussed how my own model assesses current futures prices as overvalued (see OILK: Overvalued Based On Futures Prices And Model.) In addition, a news report today indicated that an Iran nuclear deal ‘imminent’ with crippling sanctions removed. If a deal is made, Iran may be able to produce and export an additional 1.3 million barrels per day. Such a development would provide a major downward pressure on oil prices.
[ad_2]
Image and article originally from seekingalpha.com. Read the original article here.