

[ad_1]
deepblue4you
Thesis
Energy Select Sector SPDR ETF (NYSEARCA:XLE) and Technology Select Sector SPDR ETF (NYSEARCA:XLK) have exhibited the most contrasting performances over the past year that’s not seen over the past five or ten years, as the XLE significantly outperformed. XLE’s record performance has been driven by the mean-reversion from its massive March/April 2020 COVID bottom, accentuated by the escalating geopolitical conflict and tight supply/demand dynamics.
In contrast, XLK’s ride to its November 2021 top was significantly undone by unsustainable growth/tech valuations, coupled with the Fed’s commitment to fighting inflation and executing its massive QT program.
Notwithstanding, corporate insiders on the XLE are bailing out in massive numbers that have well exceeded its 10Y highs and maintaining. On the other hand, corporate insiders sells on the XLK have reached levels well below its 10Y lows. Does it make sense?
Our price action analysis on the XLE and XLK indicates that the insiders know something that we don’t. It also corroborates our findings on the EPS growth trend for both sectors over the next five years. Based on S&P Cap IQ data, the energy sector’s estimated 5Y forward EPS CAGR reads -3.4%, while tech’s 5Y forward EPS CAGR is estimated at 14.1%.
Accordingly, we rate XLE as a Hold for now, as it’s at a near-term bottom. We will subsequently reassess our rating if it forms another bull trap (indicating that the market rejects further buying upside decisively). We rate XLK as a Buy, given tech’s much-improved valuation and potential bottoming process.
XLK/XLE: Leaning Increasingly Bullish
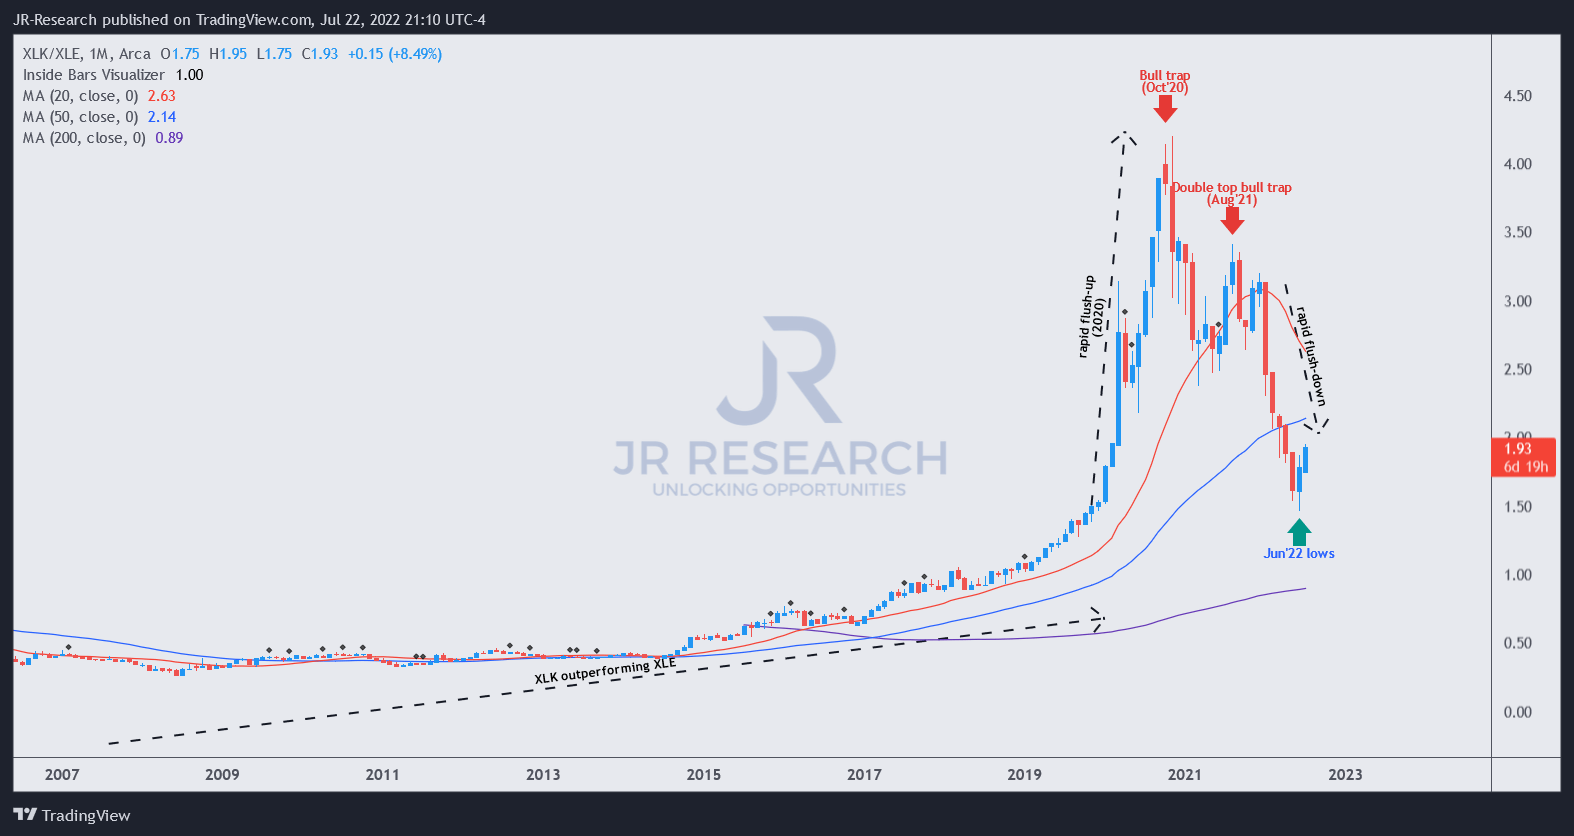
XLK/XLE price chart (monthly) (TradingView)
One way investors can see the price action dynamics between the XLK and the XLE over time is to use the XLK/XLE chart. We can also use it to glean sector rotations and potential significant market bottoming or topping price structures.
As seen in the XLK/XLE long-term chart, tech has outperformed energy consistently from 2009’s bottom. However, the March 2020 COVID bottom led to a vertical rocketship-esque outperformance in 2020, culminating in a bull trap in October 2020.
We have learned that such vertical rapid run-up price structures are often unsustainable. The Fed-induced tech and growth bubble had therefore done massive disfavor for tech investors, as it spurred “bloviated bull,” in the words of Berkshire (BRK.A) (BRK.B) CEO Warren Buffett. So have we been caught in the tech carnage?
Absolutely. But, we have also learned valuable lessons. What doesn’t kill you makes you stronger. So, we internalized our lessons and observed similar price structures on the XLK/XLE currently, but in an inverse manner.
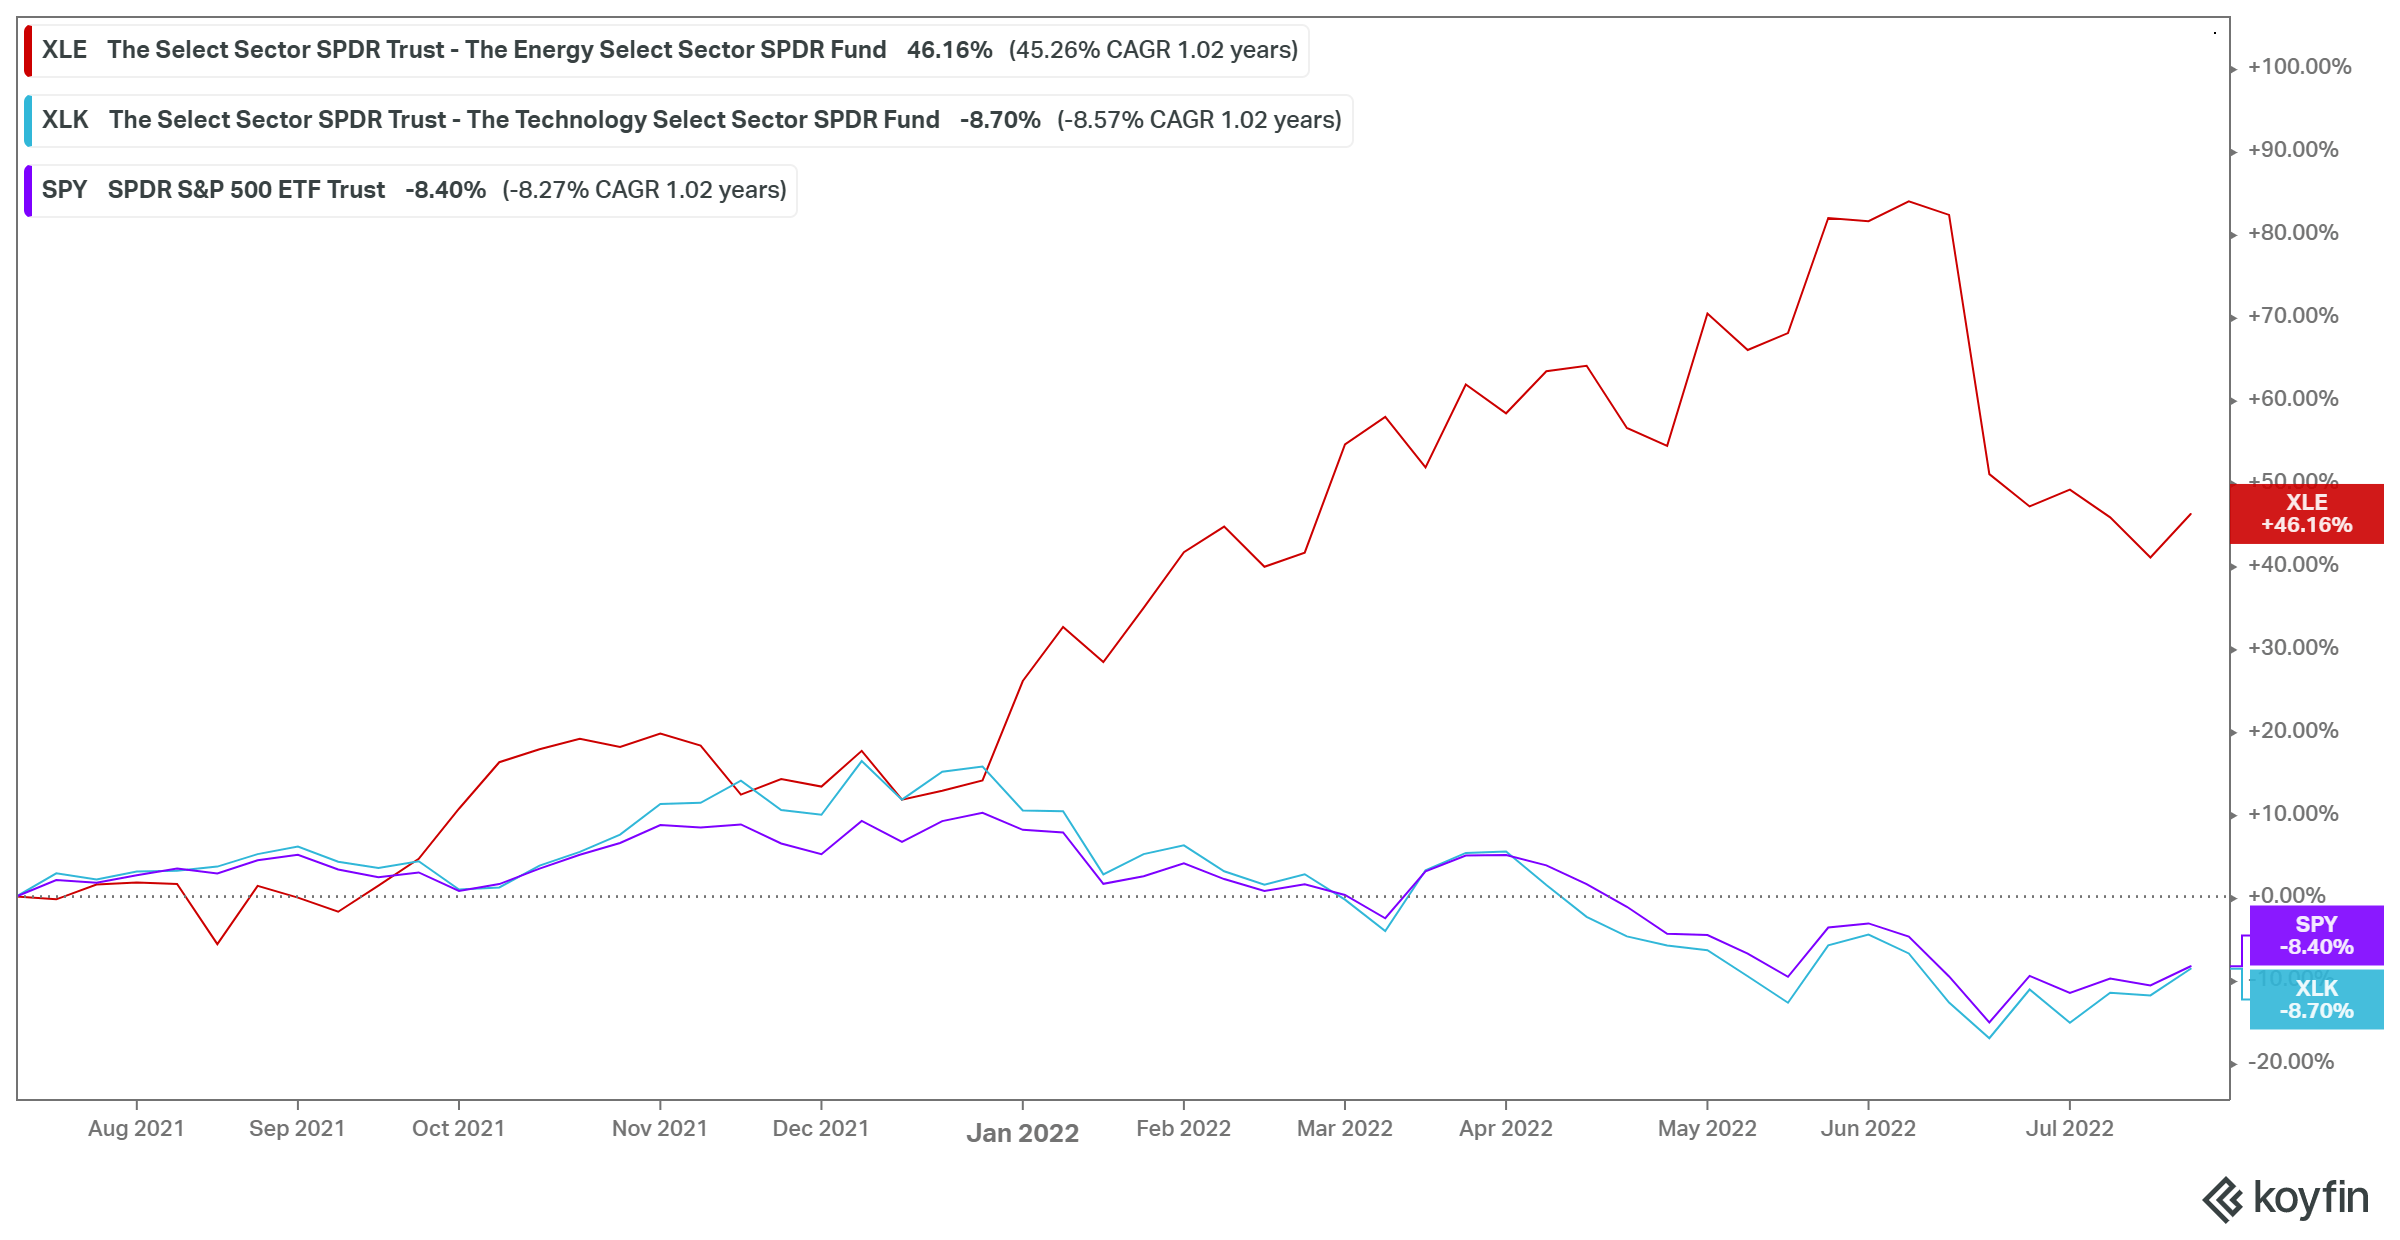
XLE and XLE 1Y performance % (koyfin)
As seen above, the XLE (1Y: 46.6%) has significantly outperformed the XLK (1Y: -8.7%) over the past year. Also, note the close performance correlation between the XLK and the SPDR S&P 500 ETF (SPY), as we will return with a discussion subsequently.
So, we learned that vertical rocketship-esque (upward) outperformance is unsustainable. Similarly, we have also observed that inverted rocketship-esque (downward) outperformance is also unsustainable from our past analysis. That kind of outperformance from the XLE is clearly printed in our XLK/XLE long-term chart.
Therefore, energy investors, please be cautious. Does our price action analysis corroborate the insider sells observations on the XLK and XLE? We believe so. Therefore, if you are selling tech and adding energy now, remember that energy and tech insiders are not with you.
Furthermore, note that the XLK/XLE appears to have formed a bottom in June. The question is, is that bottom sustainable? Do we have a confirmation signal?
The S&P 500 and XLK Have Likely Formed Their Long-Term Bottoms
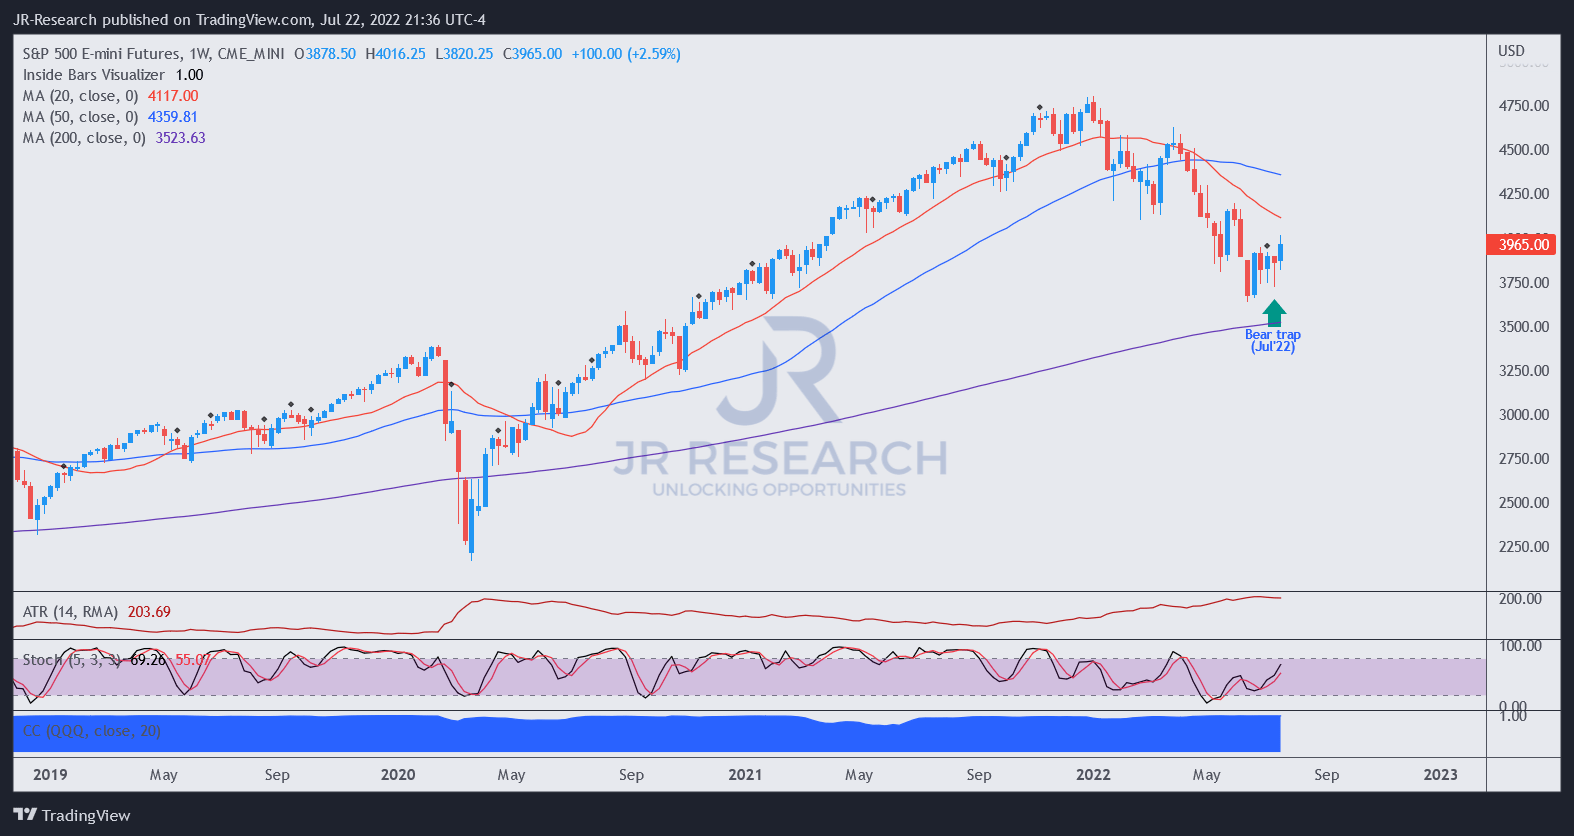
S&P 500 futures price chart (TradingView)
The S&P 500 Futures (SPX) (SPY) formed a validated bear trap last week. However, we don’t think it will be the recovery we saw in 2020 or 2018. The price structures preceding last week’s bear trap don’t lend credence to such a recovery prognosis.
We expect this market recovery to be filled with significant ups/downs to tire investors and allow the market to accumulate and ensnare short-term investors on the long and short sides. Short-term traders are urged to tread very carefully, as the current environment has been filled with a series of astute bull/bear traps. The dynamics are much more challenging and complex than we observed in the 2018 and 2020 bear market. Given the macro headwinds and a hawkish Fed, it makes sense.
But, we believe green shoots of a significant market bottom have appeared, which is constructive for long-term dip buyers (even though there could be near- medium-term volatility).
Market bottoms are often formed when most investors least expect it. That’s why it’s called a bottom (used to trap pessimistic/bearish investors or traders into executing directionally-bearish bets or selling their shares at the absolute lows).
Given the performance and price action correlation between the S&P 500 and the XLK, we believe the XLK has also likely formed a long-term bottom.
Are the XLE and XLK a Buy, Sell, Or Hold?
We rate the XLE as a Hold, as it’s at a near-term bottom. However, we believe the price action on its long-term chart points to further downside after a short-term rally to draw in dip buyers.
We rate the XLK as a Buy as we believe it’s likely at a long-term bottom.
[ad_2]
Image and article originally from seekingalpha.com. Read the original article here.