

[ad_1]
Gearstd/iStock via Getty Images
This article series aims at evaluating ETFs regarding the relative past performance of their strategies and quality of their current portfolios. As holdings and their weights change over time, updated reviews are posted when necessary.
FID strategy and portfolio
The First Trust S&P International Dividend Aristocrats Fund (NASDAQ:FID) has been tracking the S&P International Dividend Aristocrats Index since 8/22/2013. As of writing, it has 75 holdings (excluding cash and equivalents), a 12-month distribution yield of 4.8% and a total expense ratio of 0.60%. It pays quarterly distributions.
As described by First Trust, eligible stocks must:
- Be constituents of the S&P Global Broad Market Index, excluding the U.S.,
- Have an average daily traded value of at least $5 million and a float-adjusted market capitalization of at least $1 billion,
- Not have decreased dividends any year for at least 10 consecutive years,
- Have positive earnings per share,
- Have a dividend payout ratio inferior or equal to 100%,
- Have an indicated dividend yield inferior or equal to 10%.
Then, stocks with the highest indicated dividend yield are considered, with a maximum of 20 stocks by country and a maximum of 35 stocks by GICS sector. At each annual rebalancing, constituents are weighted by dividend yield with a maximum of 3% by holding and 25% by country and sector.
Large and mega-caps represent 62% of asset value. Asia is the heaviest region (40%), followed by Europe (33%) and North America (25%). The top 3 countries are Canada (25%), Japan (17.4%) and Hong Kong (16.3%). The latter represents a significant exposure to geopolitical and regulatory risks related to China. The next chart plots the top 10 countries, which represent 88% of asset value.
FID countries (chart: author; data: First Trust)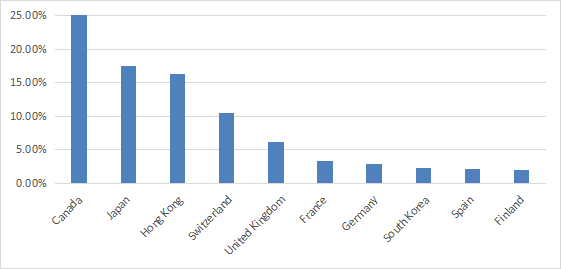
The portfolio is quite concentrated in three sectors: financials (25.2%), utilities (23.4%) and real estate (16.3%). Other sectors weigh no more than 8% individually and 35% in aggregate.
FID sectors (chart: author; data: First Trust)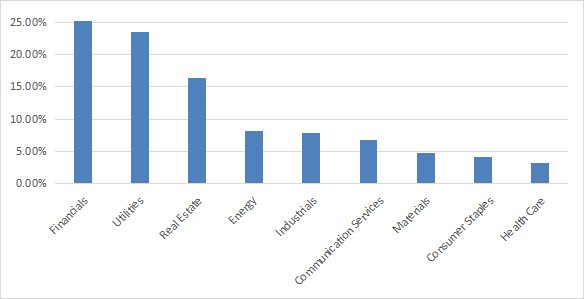
FID is much cheaper than the US benchmark S&P 500 (SPY) regarding valuation ratios (see next table). However, metrics are skewed by the top sectors and countries. Every country and industry has different averages. In particular, financials have much cheaper valuation ratios than other sectors, and they are less meaningful. Ratios also are significantly lower in Canada: the aggregate P/E of the MSCI Canada Index is about 12.
|
FID |
SPY |
|
|
Price / Earnings TTM |
9.54 |
19.63 |
|
Price / Book |
0.93 |
3.72 |
|
Price / Sales |
0.82 |
2.4 |
|
Price / Cash Flow |
6.45 |
14.98 |
The top 10 holdings, listed below, represent 21% of asset value. The heaviest one weighs 2.32%, so risks related to individual stocks are low.
|
Name |
Identifier |
Sector |
Weight |
|
Sino Land Company Limited |
83.HK |
Real Estate |
2.32% |
|
KT&G Corporation |
033780.KS |
Consumer Staples |
2.24% |
|
Keyera Corp. |
KEY.CN |
Energy |
2.23% |
|
Enagas S.A. |
ENG.SM |
Utilities |
2.14% |
|
Capital Power Corporation |
CPX.CT |
Utilities |
2.12% |
|
Electric Power Development Co., Ltd. |
9513.JP |
Utilities |
2.05% |
|
Takeda Pharmaceutical Company Limited |
4502.JP |
Health Care |
2.04% |
|
Arca Continental, S.A.B. de C.V. |
AC*.MM |
Consumer Staples |
1.96% |
|
Sun Hung Kai Properties Limited |
16.HK |
Real Estate |
1.95% |
|
BAE Systems Plc |
BA/.LN |
Industrials |
1.93% |
FID vs. competitors
The next table compares the fund’s performance and risk metrics with other non-hedged international dividend funds since 1/1/2016: Schwab Fundamental International Large Co ETF (FNDF), iShares International Select Dividend ETF (IDV), Invesco FTSE RAFI Developed Markets ex-U.S. ETF (PXF), First Trust Dow Jones Global Select Dividend ETF (FGD), SPDR S&P Global Dividend ETF (WDIV), MSCI EAFE High Dividend Yield Equity ETF (HDEF), and Global X SuperDividend ETF (SDIV).
|
since Jan.2016 |
Total Return |
Annual Return |
Drawdown |
Sharpe ratio |
Volatility |
|
FID |
14.82% |
2.07% |
-38.96% |
0.2 |
17.30% |
|
FNDF |
34.89% |
4.53% |
-40.09% |
0.29 |
16.76% |
|
IDV |
22.65% |
3.06% |
-41.64% |
0.21 |
18.00% |
|
PXF |
29.97% |
3.95% |
-41.56% |
0.26 |
17.32% |
|
FGD |
29.93% |
3.95% |
-43.26% |
0.24 |
18.59% |
|
WDIV |
32.59% |
4.26% |
-40.11% |
0.27 |
16.76% |
|
HDEF |
18.11% |
2.49% |
-36.87% |
0.19 |
15.17% |
|
SDIV |
-29.18% |
-4.97% |
-56.62% |
-0.14 |
22.56% |
Data calculated with Portfolio123
As a reference, SPY has an annualized return of 11.6% in the same period. FID has lagged behind all of them except SDIV, which is the only one in loss here. SDIV has the highest yield and the worst performance, showing once again risks of high yield funds. I have pointed out in several ETF reviews that securities with yields above 6% suffer from capital decay on average (there are rare exceptions). The next chart compares FID with the best performer in the list above: FNDF.
FID vs. FNDF since 2016 (Portfolio123)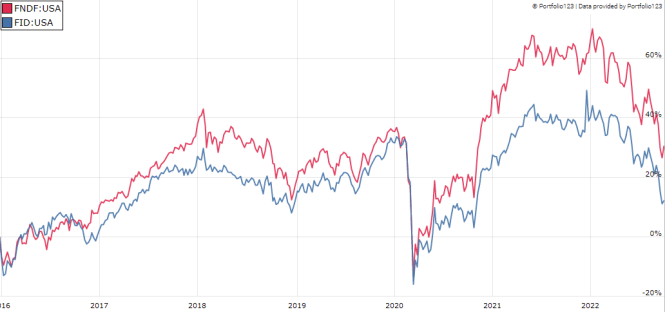
In fact, FID has suffered a steady capital decay, losing about 30% in share price since inception.
FID share price (Trading View on Seeking Alpha)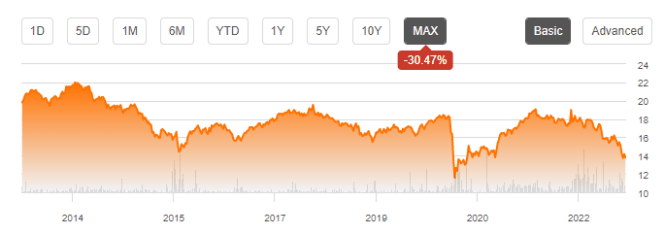
Takeaway
FID ETF holds 75 international dividend stocks of large and mid-size companies. The top 3 countries are Canada, Japan and Hong Kong. About 16% of asset value is invested in the Hong Kong market, involving geopolitical and regulatory risks related to China. The top 3 sectors are financials, utilities and real estate. Valuation metrics look very attractive, but they are biased by the sector and country breakdown. Past performance is underwhelming: FID has lagged 6 of its direct competitors in the same asset category since 2016. It has suffered a 30% capital decay since inception. For transparency, a dividend-oriented part of my equity investments is split between a passive ETF allocation and my actively managed Stability portfolio (14 stocks), disclosed and updated in Quantitative Risk & Value.
[ad_2]
Image and article originally from seekingalpha.com. Read the original article here.