

[ad_1]
RazvanDP/iStock via Getty Images
In times of macroeconomic stress, investment entities with precious metals exposure may provide investors with a hedge against what is otherwise spiraling downward markets. The GAMCO Global Gold, Natural Resources & Income Trust (NYSE:GGN), a Gabelli fund, might be a place for investors to park some money and collect a dividend.
The Fund
From the webpage, a slide is included for the first quarter performance.
Gabelli Funds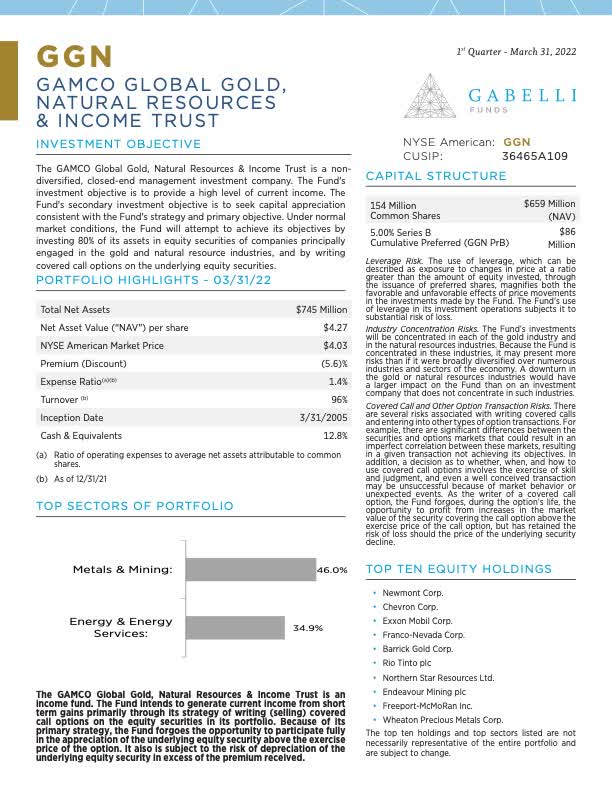
The sheet describes the fund’s purpose to provide income mainly through selling covered calls with a secondary purpose to grow Net Asset Value (NAV) if possible. Eighty percent plus is invested in energy, metals and mining, twelve percent in cash.
Also, the sheet contains a list of the top ten holders and a summary of key metrics at the quarters end. Of note, the NAV value stated is $4.27. NAV in their June 30th report equaled $3.60. A sharp decrease in particular with energy stocks driving the NAV lower during April, May and June.
The Performance Or Lack Thereof
Income from the fund over the last many years has dropped significantly from $0.07 per month to $0.03 per month. The value of the fund has been negative long-term, but stable in the last few years. We included two charts generated from TradeStation Securities, a weekly and daily, viewing longer-term and mid-term action in the CEF. The two charts give two different investment views.
TradeStation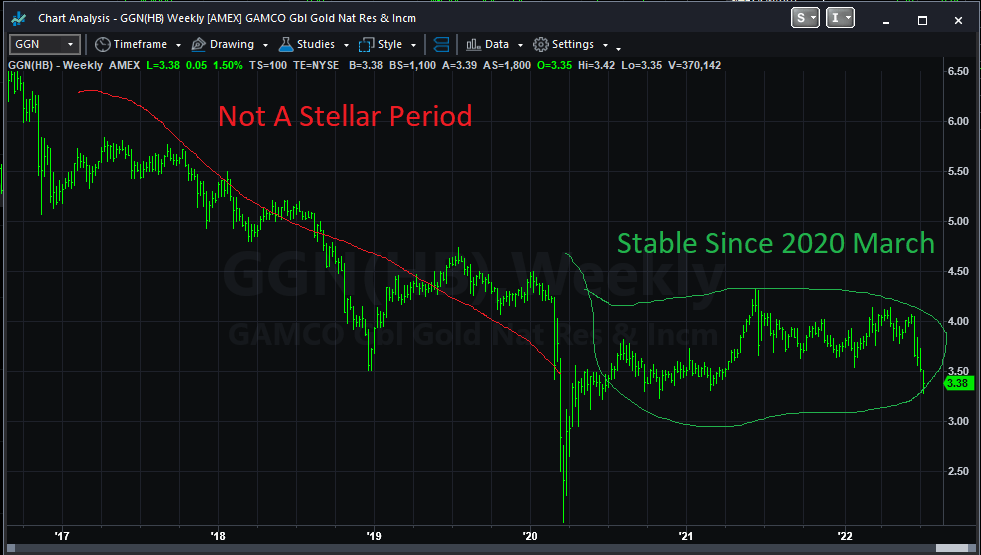
From the weekly view, since 2016, this was an avoid at all costs investment. But changes came after March of 2020 and can be seen more clearly in the next daily chart.
TradeStation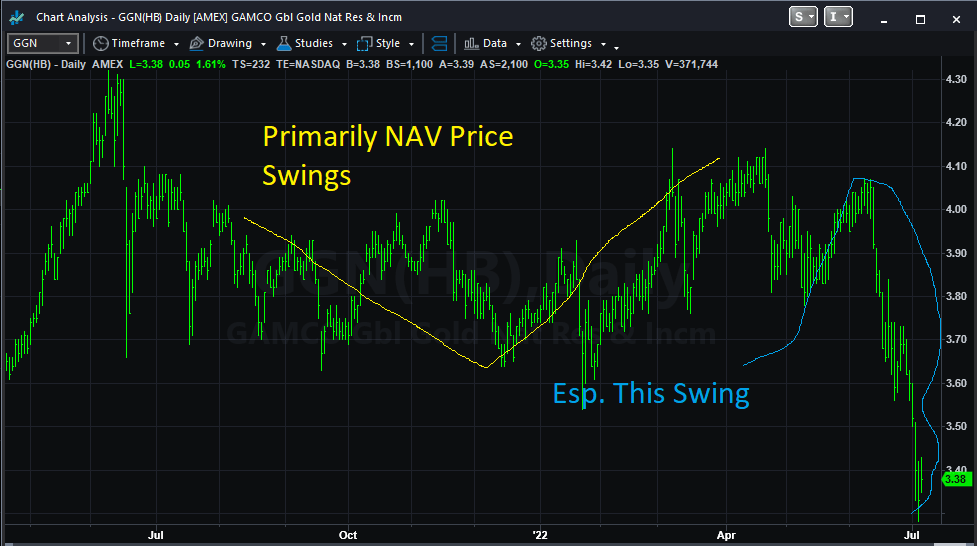
The day chart views approximately the last year magnifying swings. These swings tend to follow the Net Asset Value for the investments at least it appears so, but nothing concerning dividend return. See below for an example. In essence, the market seems to be handing investors both entry and exit points along with the fund dividend.
More Details Concerning the Daily Chart
From an investment standpoint, it’s important to understand the why for more recent price swings.
We begin with understanding the cycle nature within the last quarter. A table listing the top ten holdings from March follows.
| Stock | March 22 | June 22 | Difference | % |
| Newmont Gold | $80 | $60 | -$20 | -25 |
| Chevron | $165 | $147 | -$18 | -10 |
| Exxon-Mobile | $83 | $88 | +$5 | 5 |
| Franco-Nevada | $165 | $135 | $30 | -20 |
| Barrick Gold | $25 | $18 | $7 | -25 |
| Rio Tinto | $85 | $70 | $15 | -15 |
| Northern Star Resources | $8 | $4.75 | $3.25 | -40 |
| Endeavour Mining | $25 | $20 | $5 | -20 |
| Freeport-McMoRan | $50 | $30 | $20 | -40 |
| Wheaton Previous Metals | $48 | $37 | $11 | -20 |
| Simple Average | -20 |
At the last March quarterly report, the NAV of the fund equaled (rounded) $4.30. A twenty percent drop would place the NAV at $3.5 (rounded), the approximate closing price on June 30th. For the actual, June quarter, just released, the actual equaled $3.60. The fund has traded between the middle $4s and $3.5 or had been following the NAV further closely.
The Option Trap
When investment management uses a short covered option approach to generate cash for distributions, a trap can occur. This is particularly important with this fund. To generate income or cash and hold capital value, the calls sold must be higher, but within a reasonable distance of the price. The ideal stock actions for this strategy is one which is trapped within a range. NuStar Energy (NS) is a prime example being trapped between and $13 and $17. See the next TradeStation generated graph for NuStar.
TradeStation Securities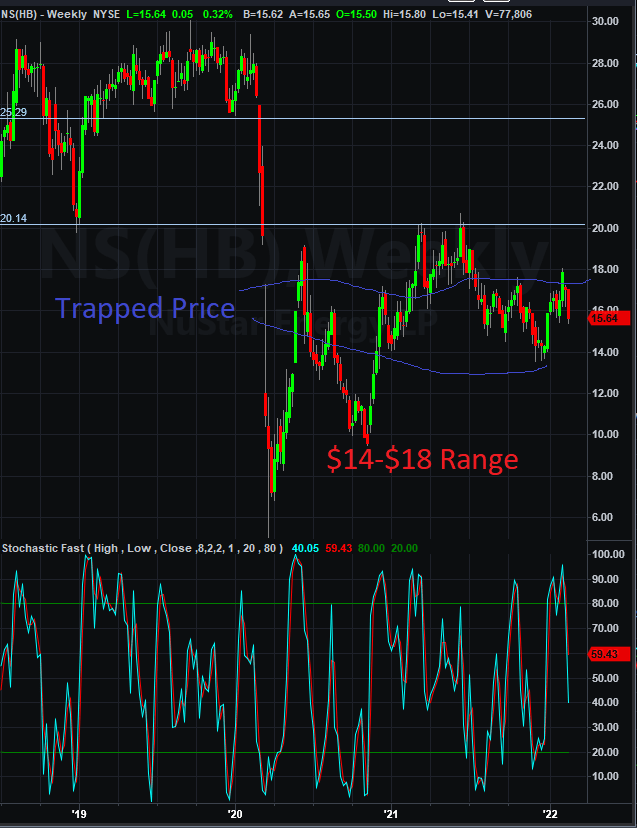
Otherwise it is difficult to hold both objectives. If the stock is in an upper movement, short calls are likely exercised. The asset growth value is shunted. At that point, management must find something inexpensive to sell calls against or take the capital loss from the shunted price. In a bearish market, the stock value drops, which requires the calls to be repurchased before the stock can be sold limiting the total cash return. We suspect that the period of time in which the NAV dropped, the period before March 2020, was influenced by this trap in some fashion.
We did look at a few of the options strike prices vs. current stock price to evaluate traps, which were found in the latest filed government document. Options expiration dates range throughout all of 2022. The next table shows results for the few evaluated.
| Company | Price * | Options |
| Rio Tinto | $70 | High 80’s |
| Phillips 66 | $80’s | $95-$105 |
| Suncor Energy | $35 | $37 |
| Williams Company | $31 | $30-$33 |
* Approximate price.
With just looking at a few, the options are reasonably above the price and will likely result in expiring worthless, thus can be sold again at a similar strike price or slightly higher.
Investment Risks
For the past two years, the CEF price seems tied directly to the NAV value or natural market action; most do in this scenario. The option payout seems steady since early 2020 offering entry points of greater yields during the weak part of cycle swings. It is difficult to evaluate how the distribution or cash generated might be changing into the future, but some reasoning suggests that it will be steady if not upward.
The precious metal companies might be at some risk with weak metal prices during a recession should one occur in the near future. We believe that the heavy energy weight will add a bullish direction to the fund with likely higher crude oil and natural gas prices continuing.
This is an entity that isn’t for the faint of heart, but we own a meager amount acting as a hedge for inflationary environments. There are risks, but we will be adding in small amounts in the near future, especially with the value significantly lower. In our view, this fund has some value for hedging.
[ad_2]
Image and article originally from seekingalpha.com. Read the original article here.