
[ad_1]
Gold Price Talking Points
The price of gold appears to be stuck in a narrow range following the failed attempt to test the yearly low ($1681), but bullion may bounce back towards the 50-Day SMA ($1747) as the Relative Strength Index (RSI) reverses ahead of oversold territory.
Gold Price Defends Yearly Low to Keep RSI Out of Oversold Territory
The price of gold bounces back from a fresh weekly low ($1692) amid a pullback in US Treasury yields, and bullion may stage larger rebound over the remainder of the week as long as it hold above the monthly low ($1689).
However, a recent speech by Federal Reserve Vice-Chair Lael Brainard suggests the central bank will stick to its hiking-cycle as “it will be necessary to see several months of low monthly inflation readings to be confident that inflation is moving back down to 2 percent,” and it seems as though the Federal Open Market Committee (FOMC) will continue to implement higher interest rates over the coming months as “monetary policy will need to be restrictive for some time to provide confidence that inflation is moving down to target.”
Source: CME
In turn, the price of gold may continue to track the negative slope in the 50-Day SMA ($1747) as Chairman Jerome Powell and Co. prepare US households and businesses for a restrictive policy, and the precious metal may face headwinds ahead of the FOMC rate decision on September 21 as the CME FedWatch Tool now shows a greater than 70% probability for a 75bp rate hike.
Until then, the price of gold may largely reflect an inverse relationship with Treasury yields as the FOMC is expected to retain its current approach in combating inflation, and it remains to be seen if the Fed will adjust the forward guidance over the coming months as the central bank aims to achieve a soft-landing for the US economy.
With that said, the failed attempt to test the yearly low ($1681) may lead to a near-term rebound in the price of gold as the RSI reverses ahead of oversold territory, but the precious metal may continue to track the negative slope in the moving average to largely mirror the price action from last month.
Gold Price Daily Chart
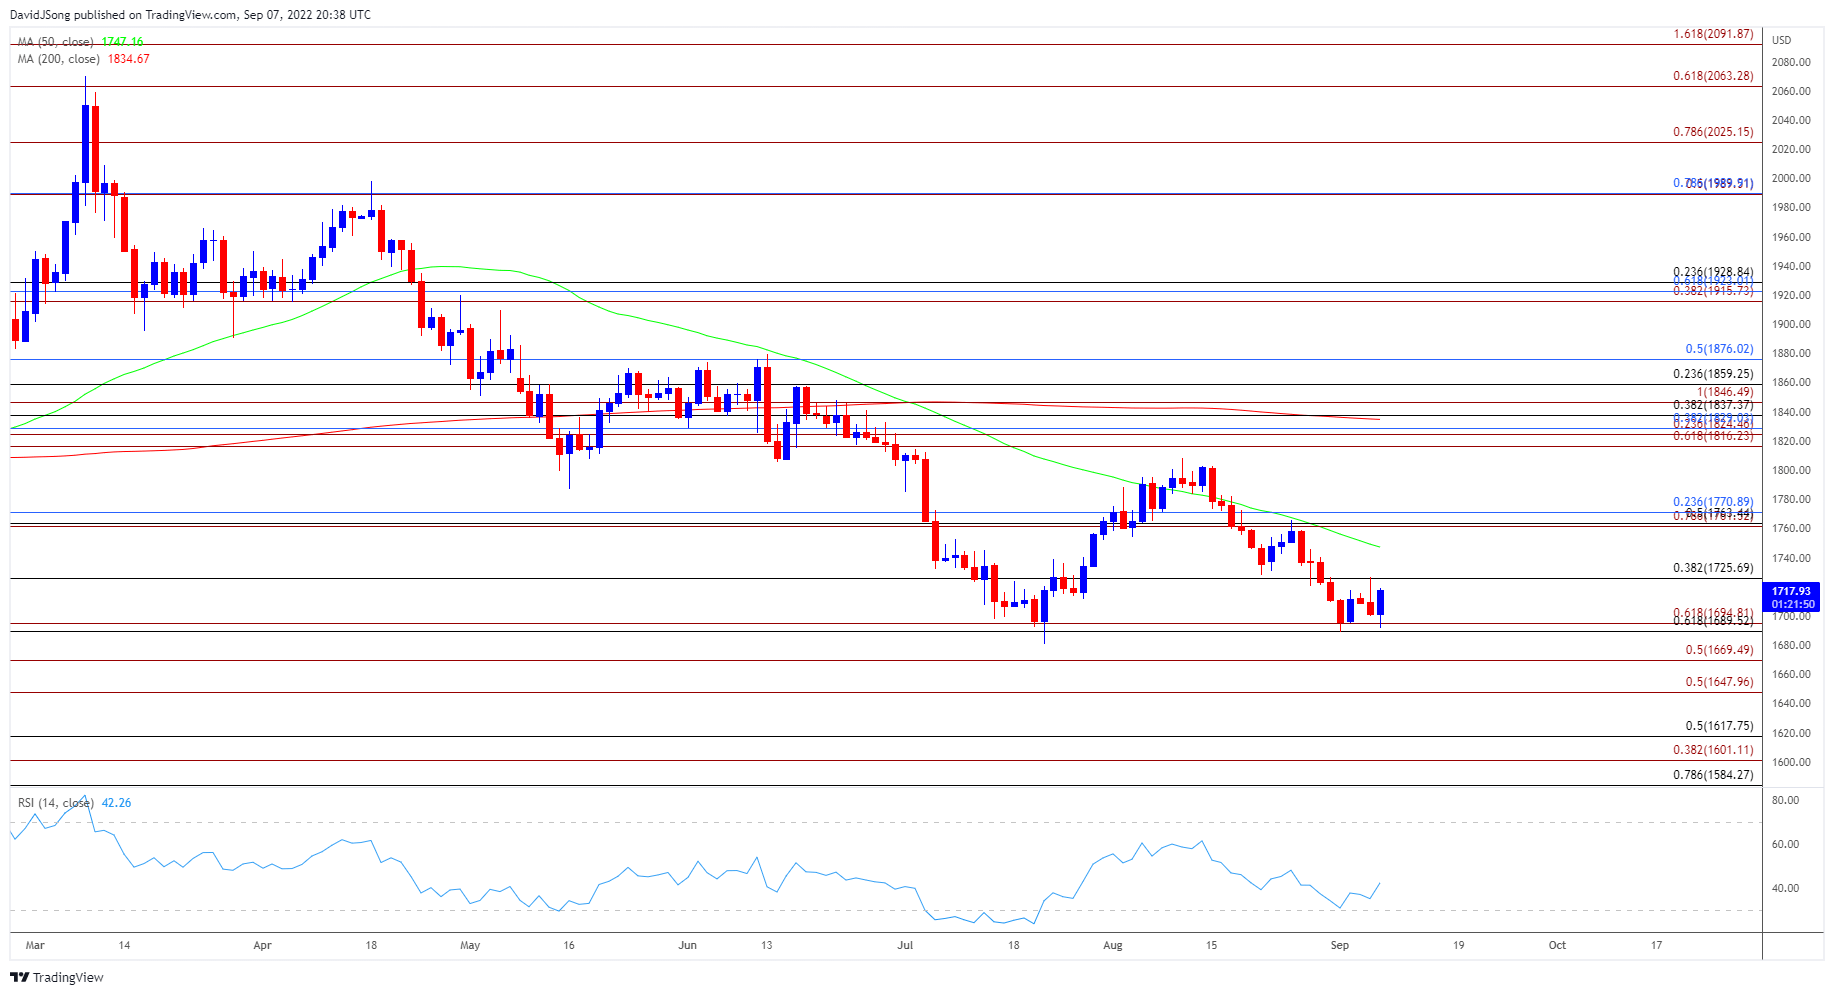
Source: Trading View
- The recent sell off in the price of gold appears to have stalled ahead of the yearly low ($1681) as the Relative Strength Index (RSI) reverses ahead of oversold territory, with the failed attempts to break/close below the $1690 (61.8% retracement) to $1695 (61.8% expansion) region raising the scope for a move towards the 50-Day SMA ($1747).
- Need a close above $1726 (38.2% retracement) to bring the moving average on the radar, with the next area of interest coming in around $1761 (78.6% expansion) to $1771 (23.6% retracement).
- However, bullion may largely mirror the price action from last month if it continues to track the negative slope in the moving average, with a break of the monthly low ($1689) along with a close below the $1690 (61.8% retracement) to $1695 (61.8% expansion) region bringing the yearly low ($1681) back on the radar.
Recommended by David Song
Traits of Successful Traders
— Written by David Song, Currency Strategist
Follow me on Twitter at @DavidJSong
[ad_2]
Image and article originally from www.dailyfx.com. Read the original article here.