
[ad_1]
GOLD, XAU/USD, US DOLLAR, FED, REAL YIELDS, TREASURIES – Talking Points
- Gold continues slipping after the Fed corrected any misperceptions
- The US Dollar and Treasury yields were lifted on the policy clarification
- If the Fed continue to talk tough on inflation, will XAU/USD test new lows?
The gold price has resumed descending as the ramification of last week’s Jackson Hole symposium continue to be felt across asset classes.
Federal Reserve Chair Jerome Powell made it clear that fighting inflation is the priority for the Fed going forward. He said, “The Federal Open Market Committee’s (FOMC) overarching focus right now is to bring inflation back down to our 2 percent goal.”
Of course, this has been the narrative for some time, but after the July FOMC meeting, the market appeared to misinterpret Powell’s remarks in regard to the Fed’s target rate being near neutral.
That is no longer the case and rate hike expectations have been lifted, sending Treasury yields higher across the curve. In turn, the US Dollar has got a boost and commodities in general have come under pressure on the back of a stronger dollar and the potential of slowing global growth.
These factors are weighing on the gold price on several fronts. Since the forum, 10-year Treasury yields are about 20 basis-points (bps) higher. At the same time, the market has lowered their expectation of where 10-year inflation is. It is down by around 10 bps, as priced by the breakeven rate on Treasury Inflation Protected Securities (TIPS).
The real yield is the nominal Treasury yield less the inflation rate for the same tenor. The US 10-year real yield is now roughly 30 bps above where it was going into the Fed forum.
US 10-YEAR TREASURY NOMINAL YIELD, US 10-YEAR BREAKEVEN INFLATION,US 10-YEAR REAL YIELD
Gold is an asset that does not bear a return, so when returns from other perceived safe-haven assets, such as Treasuries, are going north, gold tends to go south. Combined with the impact of tighter monetary conditions on the outlook of growth, commodities in general appear to be vulnerable.
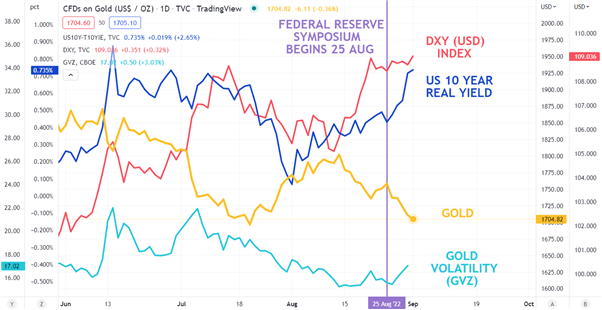
While the gold price has been slipping lower, volatility has ticked up slightly, but it is still well below the recent spike in mid-July. Gold traded as low as 1,681 an ounce at the time, which is just above the March 2020 low of 1,677. Further volatility might see the market target those levels.
GOLD AGAINST US 10-YEAR REAL YIELD,USD (DXY) INDEX AND VOLATILITY (GVZ)
— Written by Daniel McCarthy, Strategist for DailyFX.com
To contact Daniel, use the comments section below or @DanMcCathyFX on Twitter
[ad_2]
Image and article originally from www.dailyfx.com. Read the original article here.