
[ad_1]
Gold Price Talking Points
The price of gold carve a bullish outside day candle as it bounces back from a fresh yearly low ($1681), and developments surrounding the Relative Strength Index (RSI) point to a larger rebound in bullion as the oscillator climbs out of oversold territory.
Gold Price Recovery Pulls RSI Out of Oversold Territory
The price of gold appears to have reversed ahead of the March 2021 low ($1677) as the RSI pushes above 30 to establish a textbook buy signal, and bullion may stage a larger recovery ahead of the Federal Reserve interest rate decision on July 27 amid the broad based recovery across precious metals.
Looking ahead, it remains to be seen if the Federal Open Market Committee (FOMC) will retain the current path in adjusting monetary policy as the ongoing rise in the US Consumer Price Index (CPI) puts pressure on the central bank to implement larger rate hikes, and a shift in the Fed’s approach may drag on the price of gold as Chairman Jerome Powell and Co. show a greater willingness to carry out a restrictive policy.
Source: CME
Nevertheless, the FOMC may stick to its current approach as the CME FedWatch Tool now reflects a greater than 70% probability for a 75bp rate hike, and more of the same from the committee may foster a larger recovery in the price of gold amid waning expectations for a more aggressive hiking cycle.
Until then, the failed attempt to test the March 2021 low ($1677) may lead to near-term rebound in the price of gold as it carves a bullish outside day candle, with the RSI highlighting a similar dynamic as the oscillator recovers from oversold territory and climbs above 30.
With that said, the price of gold may stage a larger rebound ahead of the Fed rate decision amid waning expectations for a 100bp rate hike, but bullion may continue to track the negative slope in the 50-Day SMA ($1808) as the central bank prepares US households and businesses for a restrictive policy.
Gold Price Daily Chart
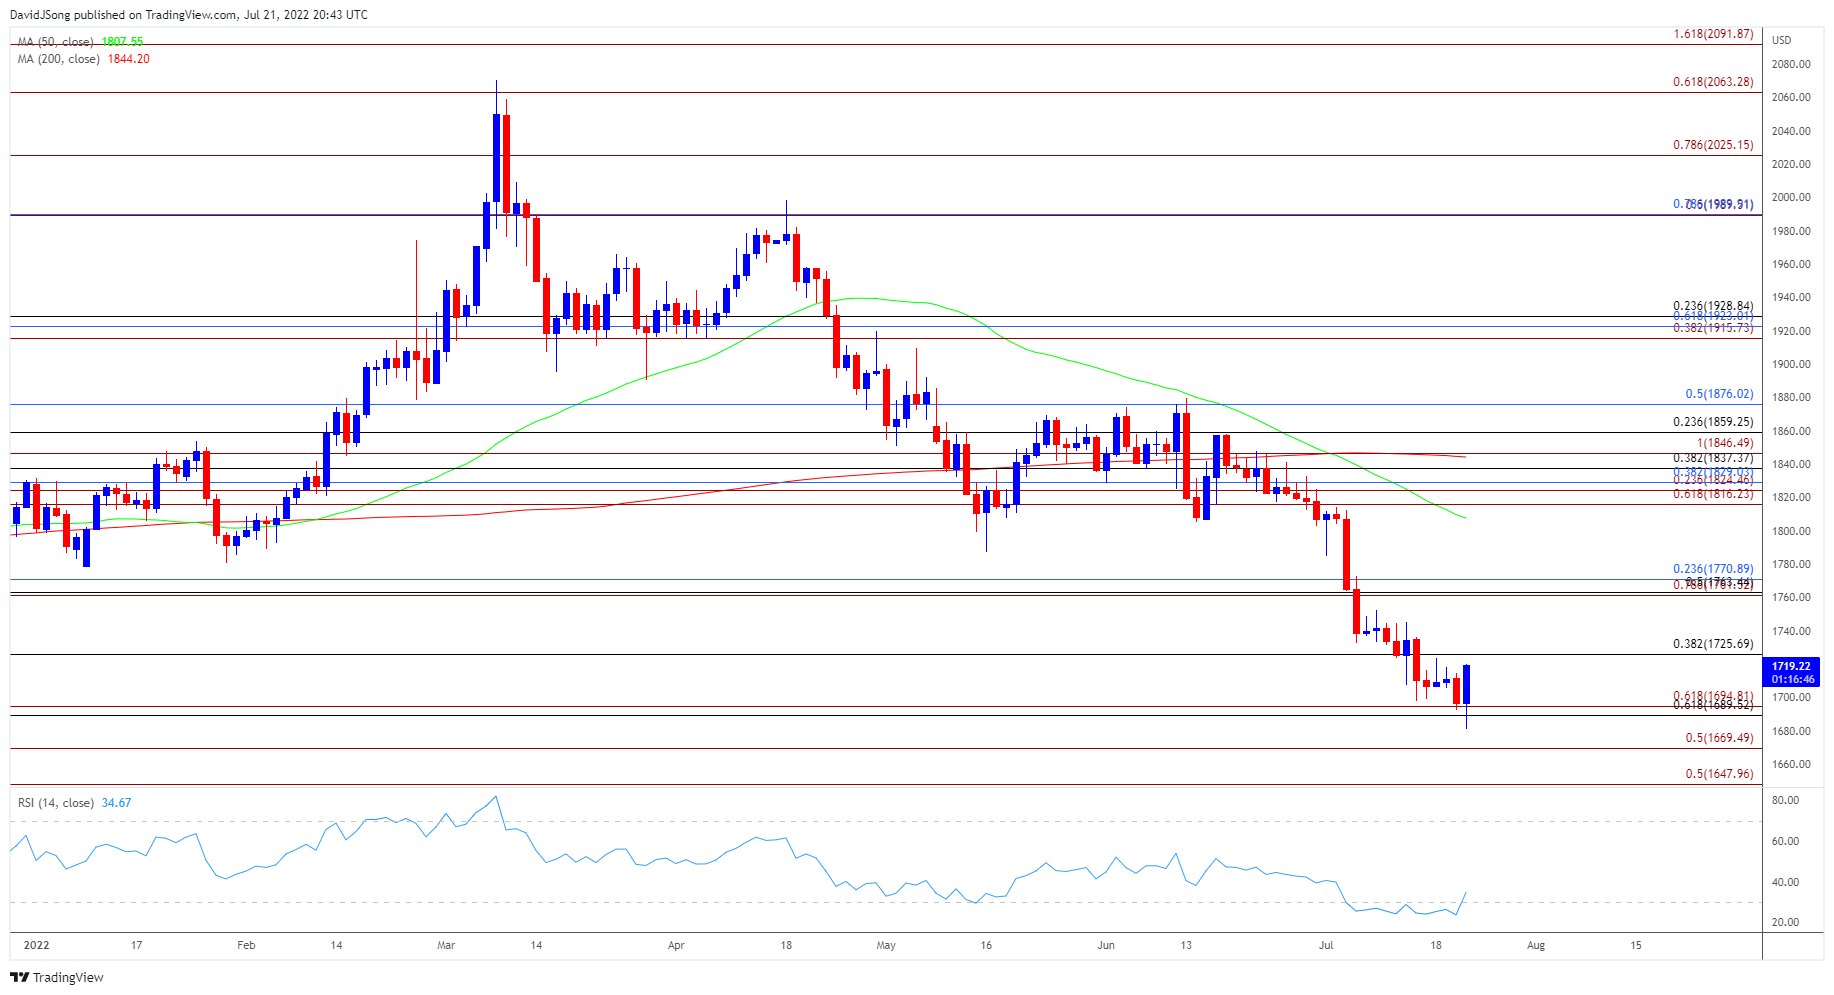
Source: Trading View
- The price of gold appears to be reversing course ahead of the March 2021 low ($1677) as it carves a bullish outside day candle, with the Relative Strength Index (RSI) pushing above 30 to indicate a textbook sell signal after falling into oversold territory for the first time in 2022.
- Lack of momentum to close below the $1690 (61.8% retracement) to $1695 (61.8% expansion) has pushed the price of gold back towards $1725 (38.2% retracement), with a further advance in bullion bringing the Fibonacci overlap around $1761 (78.6% expansion) to $1771 (23.6% retracement) on the radar.
- A move above the 50-Day SMA ($1808) brings the $1816 (61.8% expansion) region on the radar, but bullion may continue to track the negative slope in the moving average like the price action seen earlier this year.
— Written by David Song, Currency Strategist
Follow me on Twitter at @DavidJSong
[ad_2]
Image and article originally from www.dailyfx.com. Read the original article here.