

[ad_1]
Gold Price Talking Points
The price of gold threatens the monthly low ($1754) after failing to test the July high ($1814), and failure to defend the opening range for August may lead to a further decline in the precious metal as it extends the series of lower highs and lows.
Gold Price Threatens Monthly Low After Failing to Test July High
The price of gold trades back below the 50-Day SMA ($1776) as it gives back the advance following the Federal Open Market Committee (FOMC) Minutes, and bullion may track the negative slope in the moving average to largely mirror the price action from June.
It seems as though the weakness across precious metal prices will persist as long as the Federal Reserve sticks to its hiking-cycle, and it remains to be seen if the central bank will adjust the forward guidance at its next interest rate decision on September 21 as Chairman Jerome Powell and Co. are slated to update the Summary of Economic Projections (SEP).
Until then, expectations for higher US interest rates may continue to drag on the price of gold as the FOMC insists that “moving to a restrictive stance of the policy rate in the near term would also be appropriate from a risk-management perspective because it would better position the Committee to raise the policy rate further, to appropriately restrictive levels, if inflation were to run higher than expected.”
Source: CME
However, speculation for a shift in the Fed’s approach for combating inflation may heighten the appeal of gold as the CME FedWatch Tool reflects a 60% probability for a 50bp rate hike in September, and bullion may largely preserve the advance from the yearly low ($1681) as the FOMC acknowledges that “it likely would become appropriate at some point to slow the pace of policy rate increases.”
With that said, waning expectations for another 75bp Fed rate hike may limit the downside risk for the price of gold, but the precious metal may track the negative slope in the 50-Day SMA ($1776) following the failed attempt to test the July high ($1814).
Gold Price Daily Chart
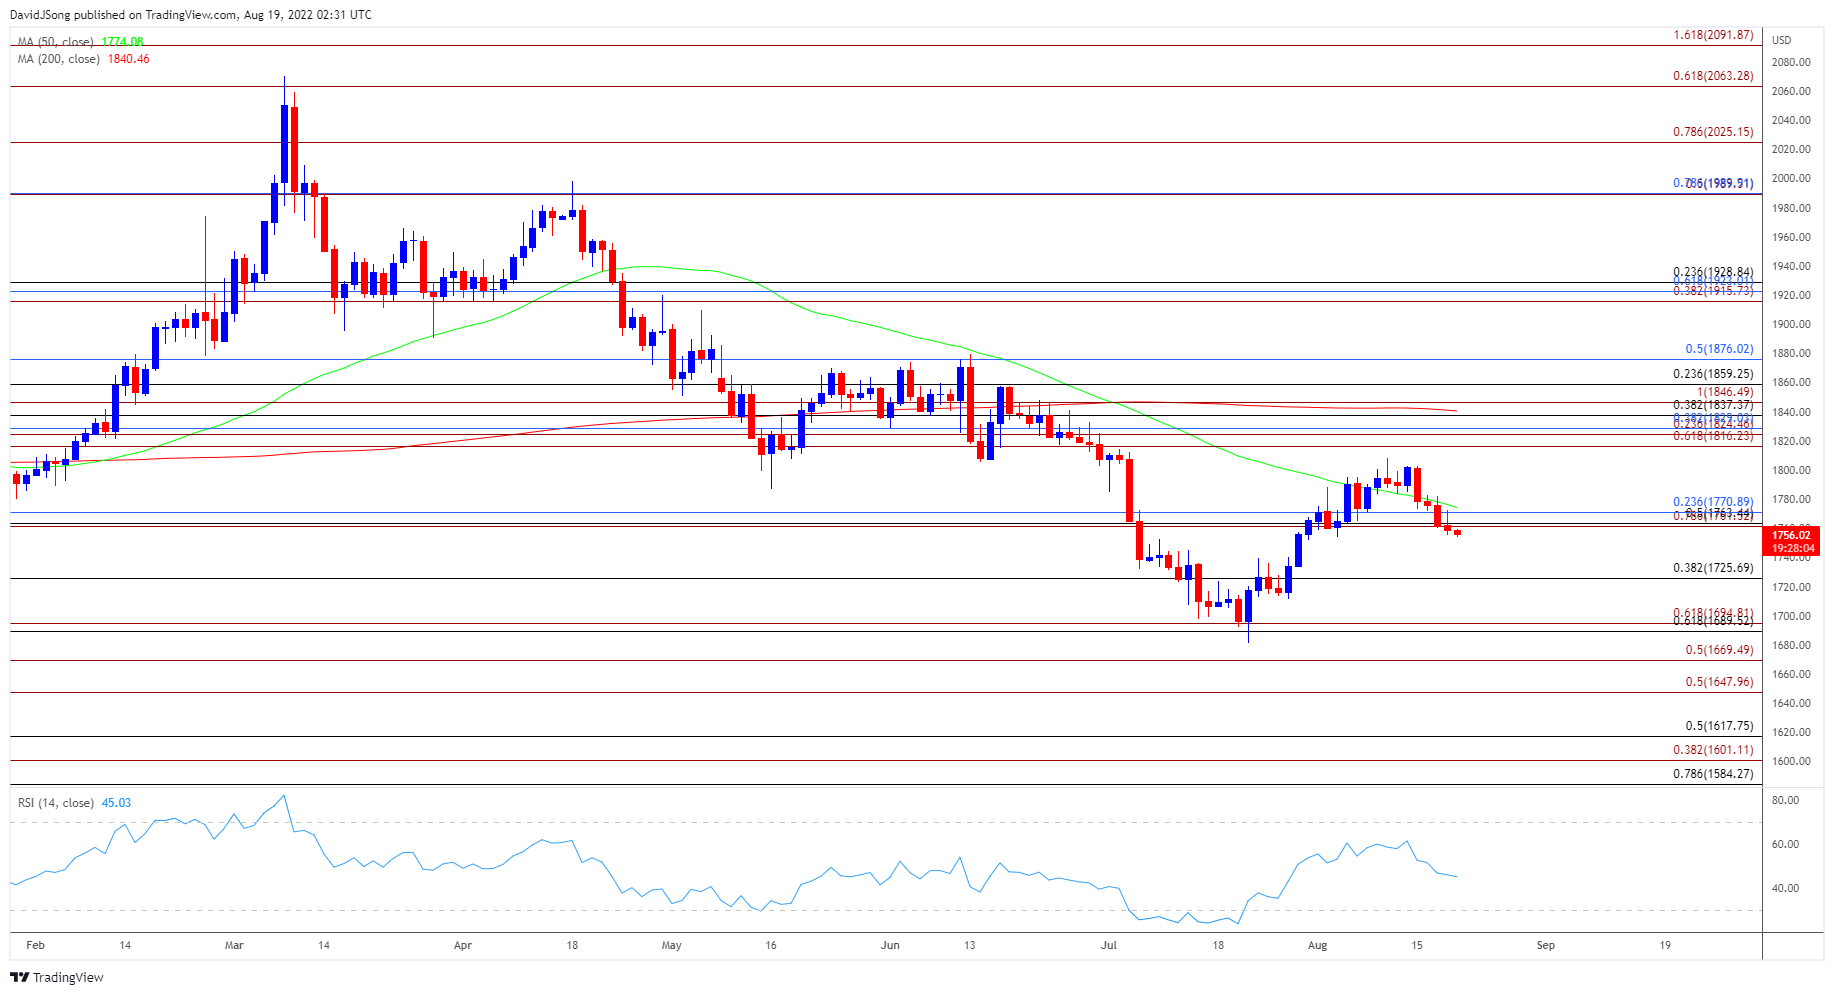
Source: Trading View
- The price of gold appears to have reversed course ahead of the July high ($1814) as it trades back below the 50-Day SMA ($1776), and the precious metal may track the negative slope in the moving average as it threatens the opening range for August.
- Lack of momentum to hold above the Fibonacci overlap around $1761 (78.6% expansion) to $1771 (23.6% retracement) may push the price of gold towards $1725 (38.2% retracement), with the next area of interest coming in around the $1690 (61.8% retracement) to $1695 (61.8% expansion) region.
- However, the price of gold may clear the bearish price series if it manages to bounce back from the monthly low ($1754), with a move above the overlap around $1761 (78.6% expansion) to $1771 (23.6% retracement) bringing the monthly high ($1808) on the radar.
— Written by David Song, Currency Strategist
Follow me on Twitter at @DavidJSong
[ad_2]
Image and article originally from www.dailyfx.com. Read the original article here.