

[ad_1]
Gold Price Talking Points
The price of gold is on the cusp of testing the yearly low ($1681) as it extends the recent series of lower highs and lows from earlier this week, and a move below 30 in the Relative Strength Index (RSI) is likely to be accompanied by a further decline in bullion like the price action seen in July.
Gold Price Weakness Pushes RSI Towards Oversold Territory
The price of gold remains under pressure after failing to push back above the 50-Day SMA ($1756), with bullion largely mirroring the decline across precious metal prices amid the rise in US Treasury yields.
As a result, the price of gold may largely track the negative slope in the moving average as the recent speech by Federal Reserve Chairman Jerome Powellfuels speculation for another 75bp rate hike, and the US Non-Farm Payrolls (NFP) report may encourage the Federal Open Market Committee (FOMC) to retain its current approach in combating inflation the update is anticipated to reflect a further improvement in the labor market.
The NFP report is expected to show the US economy adding 300K jobs in August while the Unemployment Rate is projected to hold steady at 3.5% during the same period, and a positive development may drag on the price of gold as Chairman Powell warns that “restoring price stability will likely require maintaining a restrictive policy stance for some time.”
In turn, the price of gold may face headwinds ahead of the next FOMC rate decision on September 21 as the central bank continues to carry out its hiking-cycle, and speculation surrounding Fed policy may continue to influence the precious metal as it largely reflects an inverse relationship with US Treasury yields.
With that said, the price of gold looks poised to test the yearly low ($1681) as it appears to be tracking the negative slope in the 50-Day SMA ($1756), and a move below 30 in the Relative Strength Index (RSI) is likely to be accompanied by a further decline in bullion like the price action seen in July.
Gold Price Daily Chart
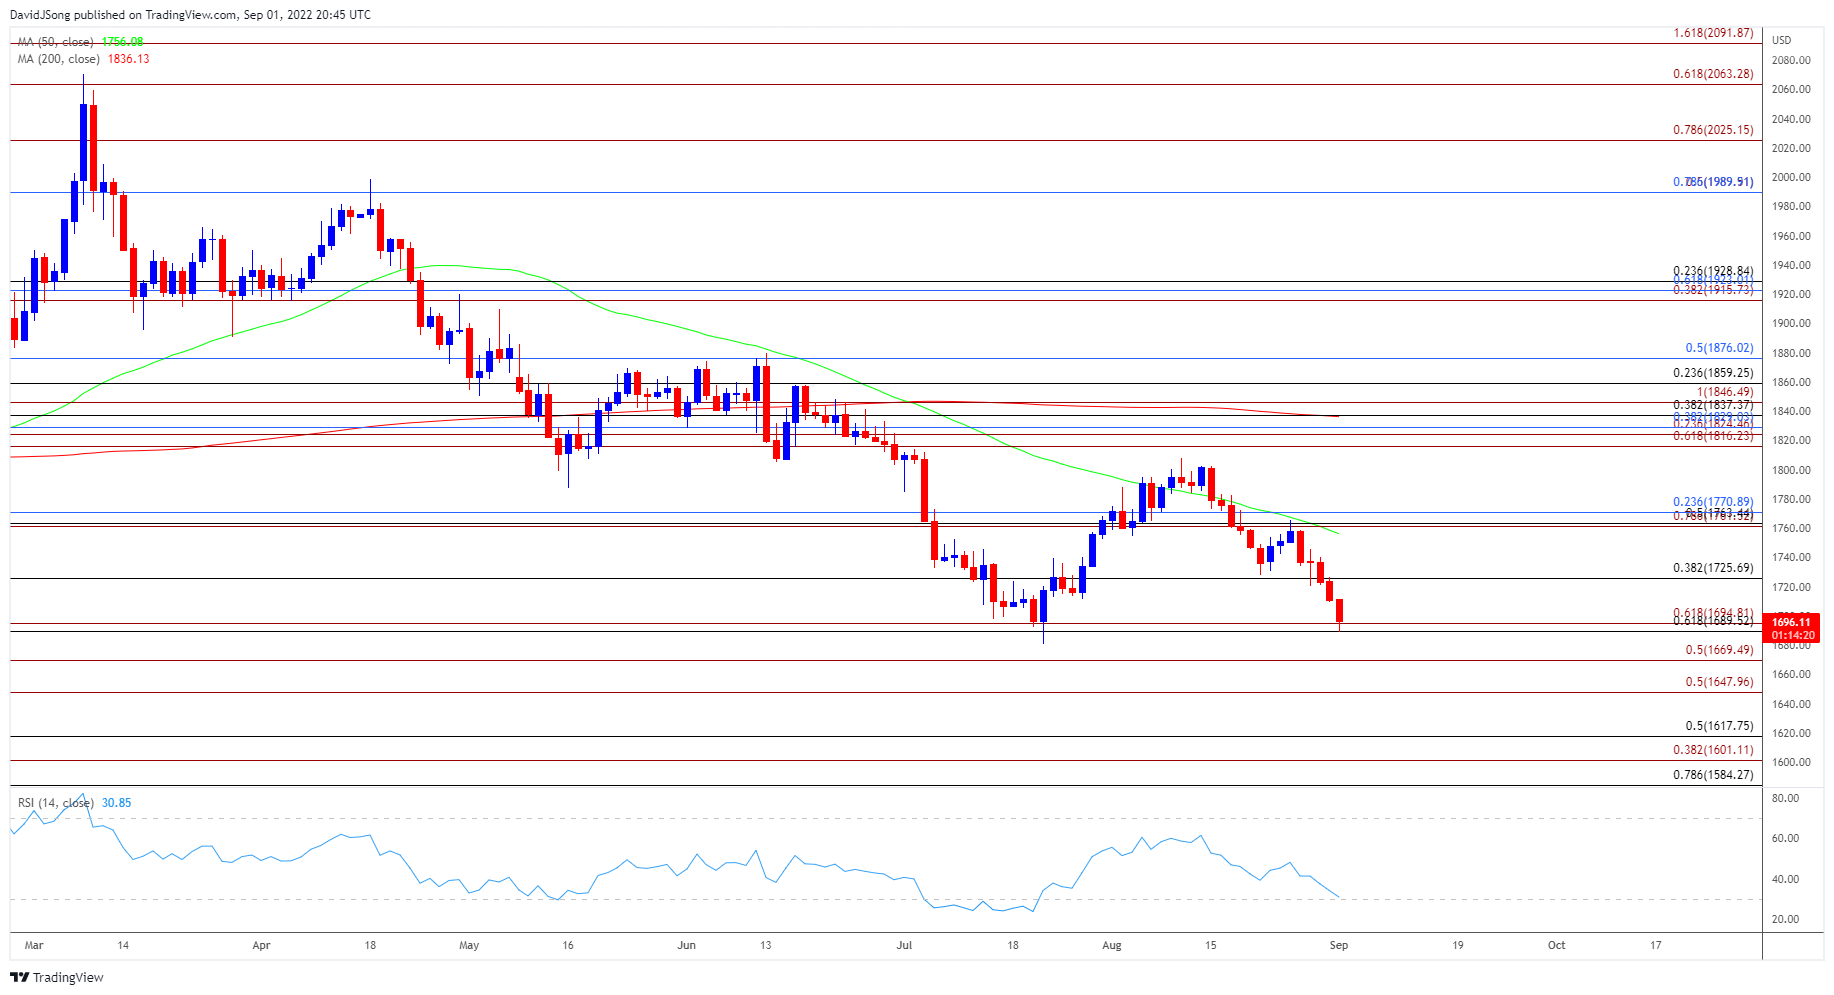
Source: Trading View
- The price of gold approaches the yearly low ($1681) after failing to push back above the 50-Day SMA ($1756), with the precious metal trading to a fresh weekly low ($1689) as it carves a series of lower highs and lows.
- Need a close below the $1690 (61.8% retracement) to $1695 (61.8% expansion) region to open up the March 2021 low ($1677), with the next area of interest coming in around $1670 (50% expansion), which largely lines up with the June 2020 low ($1671).
- Will keep a close eye on the Relative Strength Index (RSI) as it approaches oversold territory, with a move below 30 in the oscillator likely to be accompanied by a further decline in gold like the price action seen in July.
- However, lack of momentum to close below the $1690 (61.8% retracement) to $1695 (61.8% expansion) may push the price of gold back towards $1726 (38.2% retracement),with a move above the 50-Day SMA ($1756) bringing the Fibonacci overlap around $1761 (78.6% expansion) to $1771 (23.6% retracement)on the radar.
— Written by David Song, Currency Strategist
Follow me on Twitter at @DavidJSong
[ad_2]
Image and article originally from www.dailyfx.com. Read the original article here.