

[ad_1]
Gold Price Talking Points
The price of gold struggles to hold above the 50-Day SMA ($1780) as it gives back the advance from last week, and the precious metal may continue to track the negative slope in the moving average if it fails to defend the monthly low ($1754).
Gold Price Weakness to Persist on Failure to Defend August Opening Range
The price of gold appears to be reversing ahead of the monthly high ($1808) even as US Treasury yields remain under pressure, and the precious metal may threaten the opening range for August as it snaps the series of higher highs and lows from last week.
It remains to be seen if the Federal Open Market Committee (FOMC) Minutes will influence the price of gold as the slowdown in the US Consumer Price Index (CPI) dampens bets for another 75bp rate hike, but hints of a looming shift in the Fed’s approach for combating inflation may prop up the precious metal as the central bank appears to be on track to winddown its hiking-cycle over the coming months.
As a result, the statement may foreshadow a shift in the Fed’s forward guidance if a growing number of officials show a greater willingness to implement smaller rate hikes, and the price of gold may stage a larger recovery ahead of the next interest rate decision on September 21 as it trades above the 50-Day SMA ($1780) for the first time since April.
However, more of the same from the FOMC may drag on the price of gold as Chairman Jerome Powell acknowledges that “another unusually large increase could be appropriate at our next meeting,” and the rebound from the yearly low ($1681) may turn out to be a near-term correction as the moving average continues to reflect a negative slope.
With that said, the price of gold may continue to track the negative slope in the moving average with the FOMC on track to carry out a restrictive policy, and the weakness in the precious metal may persist if it fails to defend the opening range for August.
Gold Price Daily Chart
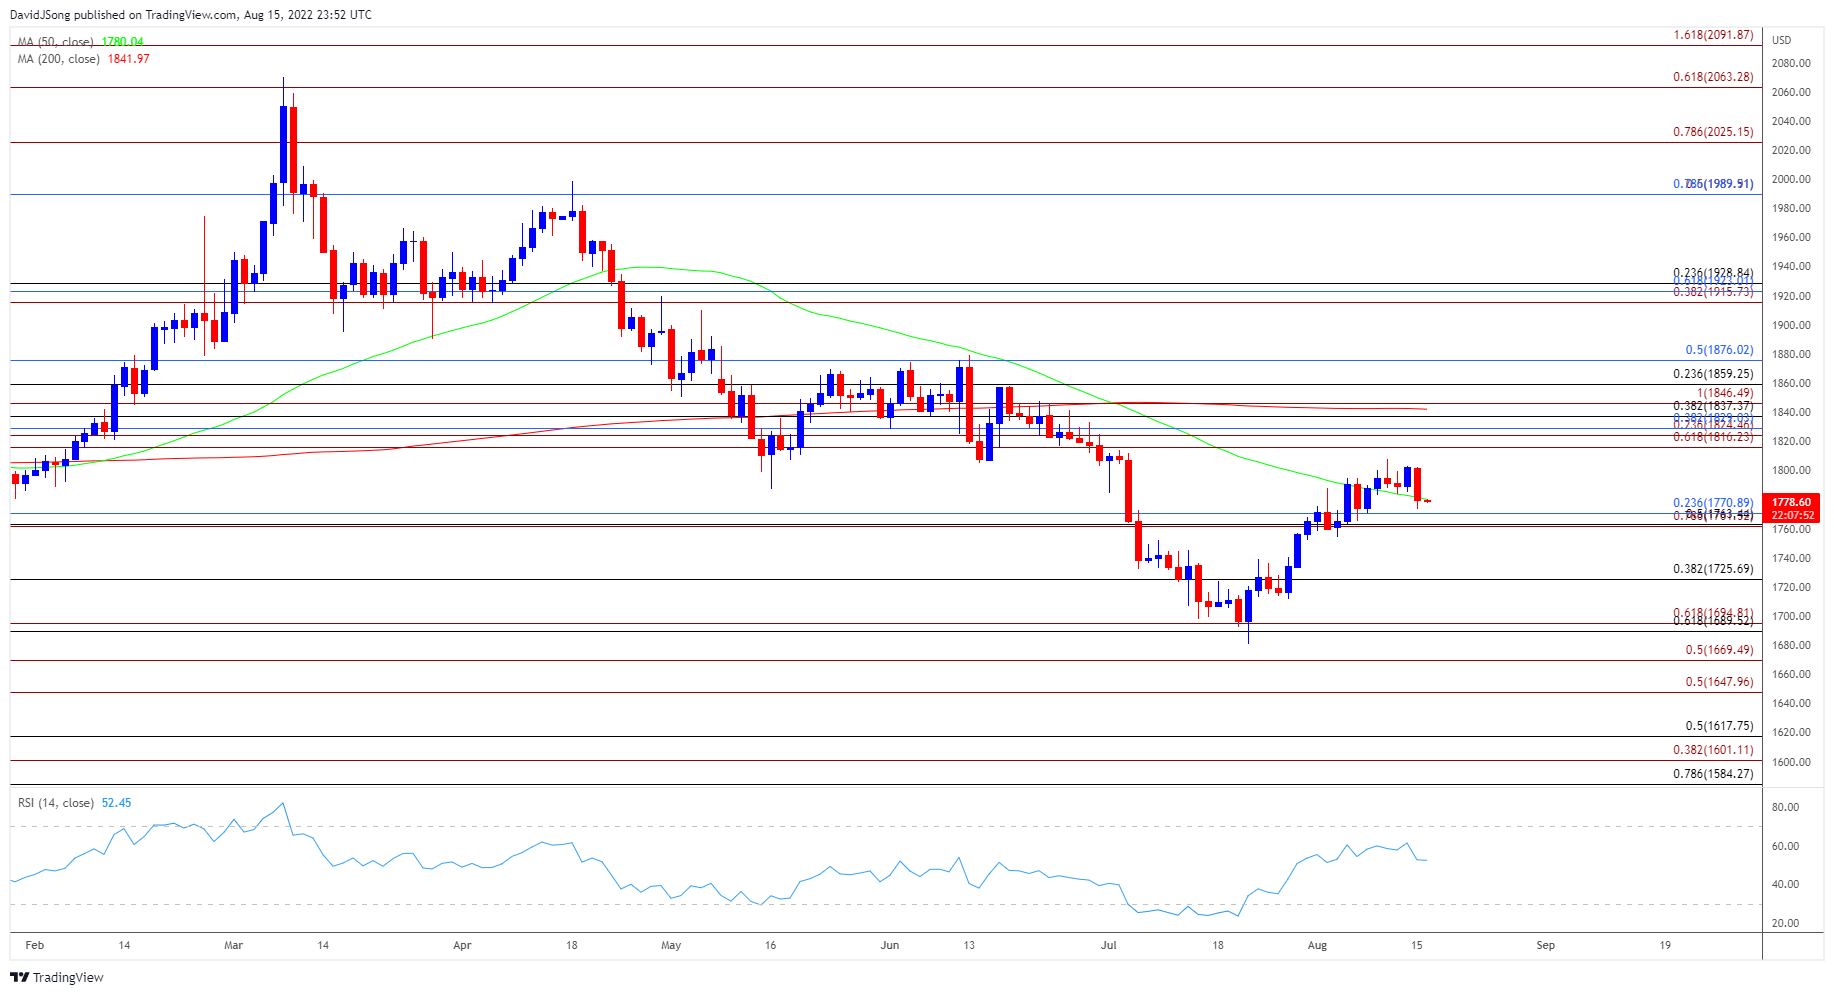
Source: Trading View
- Unlike the price action in June, gold managed to trade above the 50-Day SMA ($1780) earlier this month, with a break/close above the $1816 (61.8% expansion) region bringing the $1825 (23.6% expansion) to $1829 (38.2% retracement) region on the radar,
- However, the price of gold may continue to track the negative slope in the moving average as it appears to be reversing ahead of the monthly high ($1808), and failure to hold above the Fibonacci overlap around $1761 (78.6% expansion) to $1771 (23.6% retracement) may lead to a test of the monthly low ($1754).
- Lack of momentum to defend the opening range for August may push the price of gold back towards $1725 (38.2% retracement) area, with the next area of interest coming in around $1690 (61.8% retracement) to $1695 (61.8% expansion).
— Written by David Song, Currency Strategist
Follow me on Twitter at @DavidJSong
[ad_2]
Image and article originally from www.dailyfx.com. Read the original article here.