

[ad_1]
Gold, XAU/USD, Non-Farm Payrolls, Technical Analysis – Briefing:
- Gold price rally fades heading into US non-farm payrolls data
- Expect elevated volatility on the jobs report due to Fed impact
- XAU/USD dominant downtrend remains, watch key resistance
Recommended by Daniel Dubrovsky
How to Trade Gold
Gold prices aimed slightly lower over the past 24 hours as the strong upward momentum earlier this week notably slowed. So far this week, XAU/USD is up around 3 percent in the best 5-day performance since February. That was when Russia invaded Ukraine, triggering a flight to the yellow metal. Gold’s push higher in recent days likely reflected somewhat cooling hawkish Federal Reserve rate hike bets.
This cooled on Thursday when a slew of Fedspeak reinforced the central bank’s commitment to fighting inflation. Investors were also likely hesitant to commit to directional bias ahead of Friday’s hotly anticipated US jobs report. The country is seen adding about 255k non-farm payrolls in September, down from 308k in August.
Meanwhile, the unemployment rate and labor force participation rate are seen unchanged at 3.7% and 62.4%, respectively. Markets have lately been quite sensitive to surprises in economic data given that traders are trying to price in either a 50 or 75 basis point hike in November.
A softer outcome could easily lean those estimates to 50-basis points. Such an outcome would likely dent the US Dollar and Treasury yields, helping gold. However, the skew might be to an upside surprise. The Citi Economic Surprise Index tracking the US has been rising since June. This indicates that economists are underpricing the health and vigor of the economy.
Gold Technical Analysis
On the daily chart, gold is testing a key falling trendline from March. If it holds, the dominant downtrend could remain in play. That would place the focus back on the September low at 1614.92. If not, confirming an upside breakout could open the door to extending gains. Such an outcome places the focus on the 100-day Simple Moving Average (SMA).
Recommended by Daniel Dubrovsky
How to Trade Gold
XAU/USD Daily Chart
Chart Created Using TradingView
Gold Sentiment Analysis
Taking a look at IG Client Sentiment (IGCS), about 74% of retail traders are net-long gold. IGCS tends to function as a contrarian indicator. Since most traders are biased to the upside, this hints that prices may continue falling. But, short positioning increased by 7.73% and 33.74% compared to yesterday and last week, respectively. With that in mind, recent changes in positioning hint that prices may continue upward.
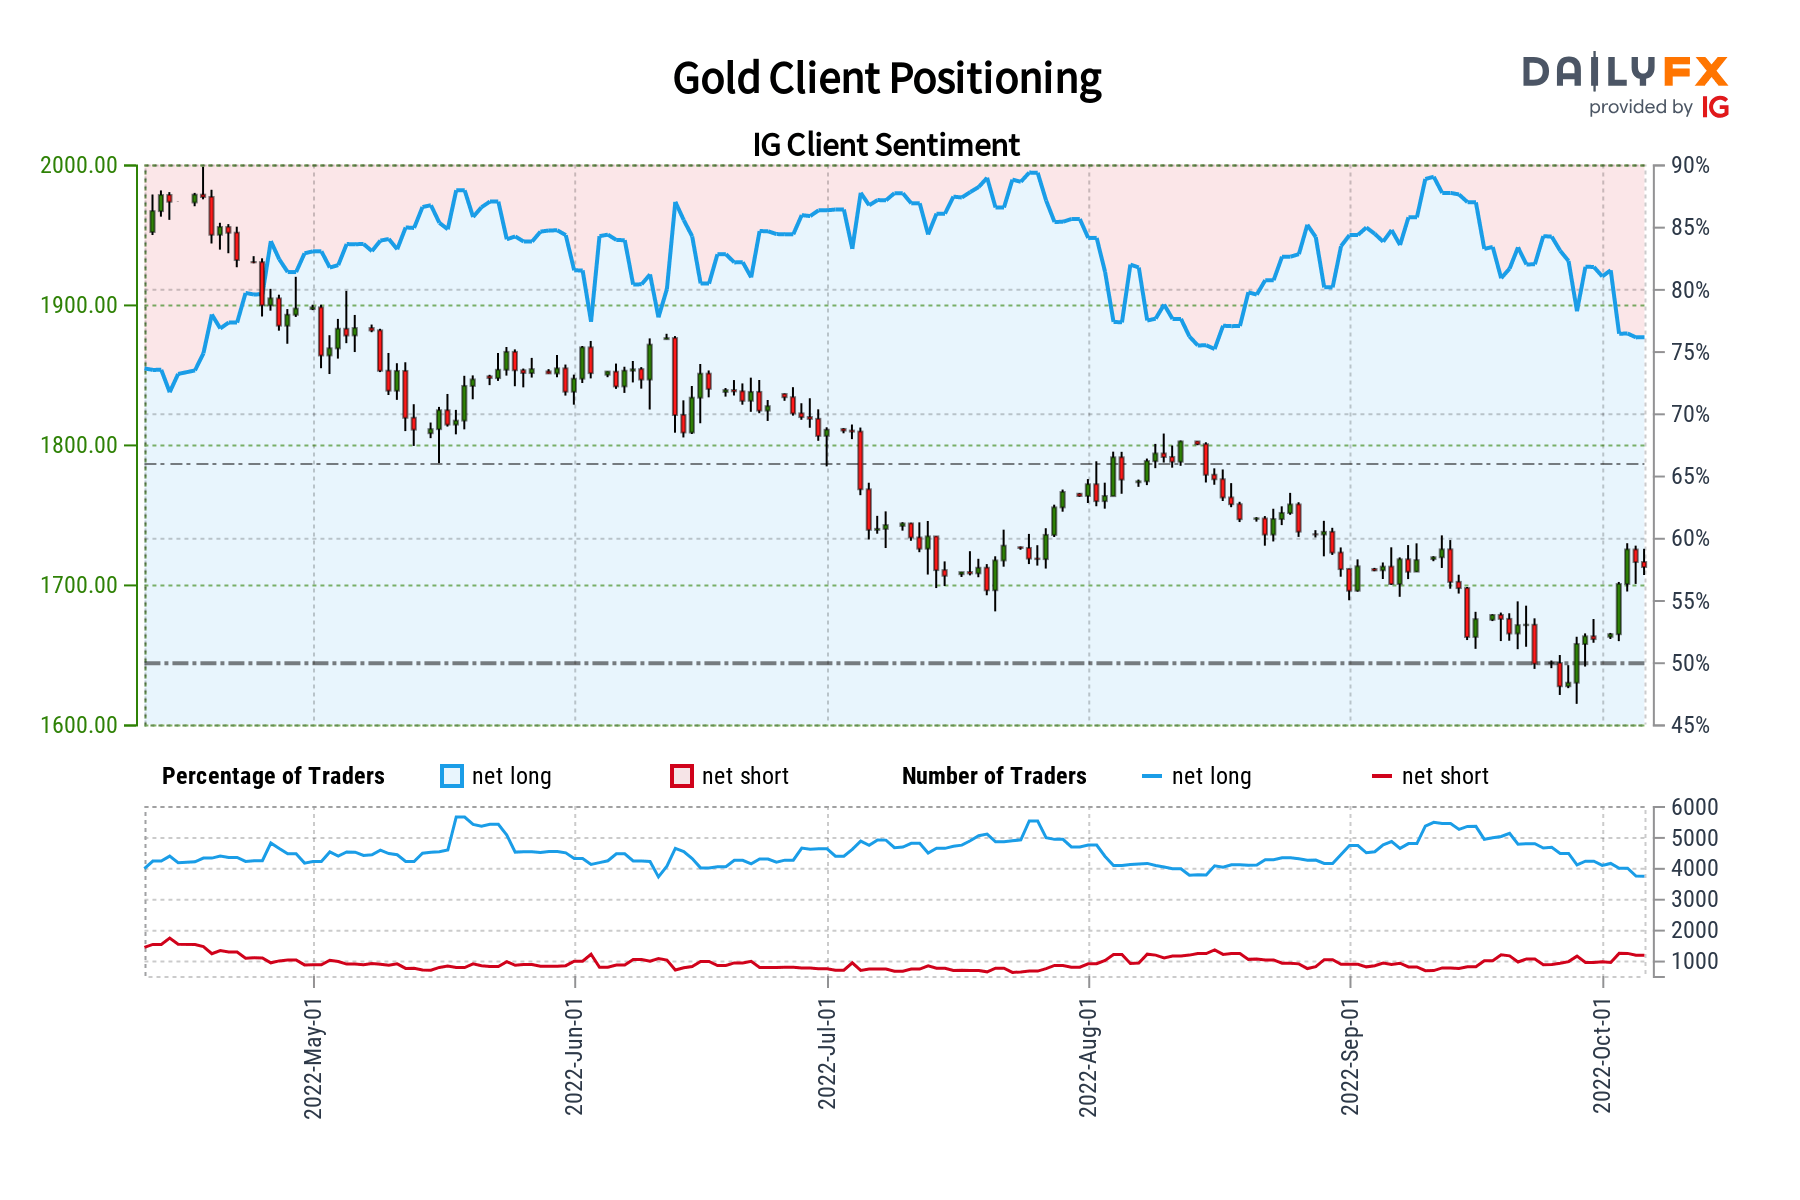
IGCS Chart Used from October 6th Report
— Written by Daniel Dubrovsky, Strategist for DailyFX.com
To contact Daniel, use the comments section below or@ddubrovskyFXon Twitter
[ad_2]
Image and article originally from www.dailyfx.com. Read the original article here.