
[ad_1]
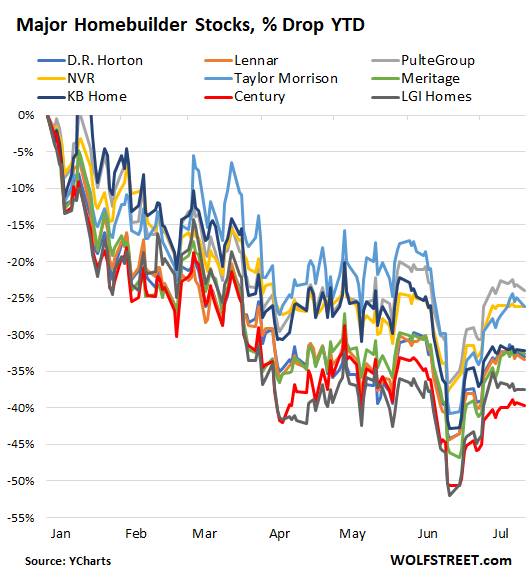
Homebuilder stocks have been wobbling lower all year, now down between 24% and 40%.
By Wolf Richter for WOLF STREET.
Homebuilders have struggled for well over a year with supply and labor shortages and ridiculously spiking costs. In addition, this year, the new holy-moly mortgage rates added to the woes, and unsold inventories surged to levels not seen since 2008, as sales fell. And homebuilder stocks have gotten hammered across the board, down year-to-date between 24% and 40%.
So, not all that surprisingly, the confidence of builders of single-family houses, as depicted by the NAHB/Wells Fargo Housing Market Index for July, released today, plunged by 12 points, the second biggest drop in the data going back 35 years, behind only the April 2020 lockdown cliff-dive, as “high inflation and increased interest rates stalled the housing market by dramatically slowing sales and buyer traffic,” the NAHB said.
It was the seventh month-to-month drop in a row. In other words, it’s been all downhill so far this year. With today’s index value of 55, it is now back where it had been in May 2015. And it’s right back where it had been in February 2006, though it was dropping a lot more slowly back then.
“Production bottlenecks, rising home building costs, and high inflation are causing many builders to halt construction because the cost of land, construction, and financing exceeds the market value of the home,” said the NAHB.
And builders are cutting prices: 13% of the builders have reacted to those conditions by reducing home prices in the past month to boost sales “and/or limit cancellations,” the report said.
Regionally, the Housing Market Index plunged by the most in the West (-16 points) and the South (-15 points), with the West and the Midwest showing the worst HMI levels of 48 and 49 respectively.
| Region | HMI, July | Point Change fr. prior month |
| Northeast | 57 | -5 |
| Midwest | 49 | -6 |
| South | 60 | -15 |
| West | 48 | -16 |
The future looks worse, homebuilders said.
There are three components in the MHI: Current sales, sales outlook for the next six months, and traffic of prospective buyers. Only the current sales component was still at a positive level.
The index for current sales plunged 12 points in July, to a value of 64, which means that still more builders rated current sales as “good” rather than “poor” (an index value of 50 would be neutral).
The index for sales over the next six months plunged by 11 points to an index value of 50, which means that builders were evenly split between those who rated their future sales as “good” and those who rated them as “poor.”
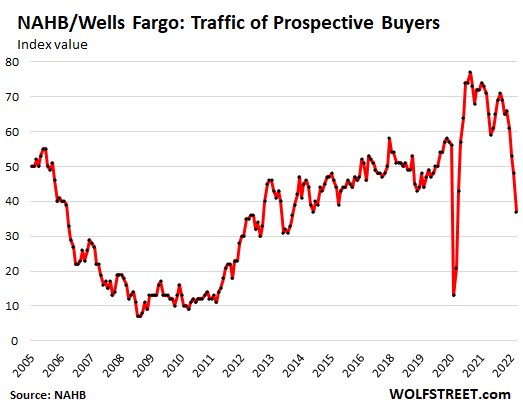
And the index for Traffic of prospective buyers plunged by 11 points, to an index value of 37, after having already dropped below 50 in June. Traffic is an indication of interest by buyers, and buyers have lost interest. That’s a real problem going forward.
For this component, builders were asked to rate traffic of prospective buyers as “high to very high,” “average,” or “low to very low.” Today’s index value of 37 means that more builders rated the market “low to very low” rather than “high to very high,” the second month in a row with below-50 reading:
Homebuilder stocks have been wobbling lower all year, interrupted by sharp bear-market rallies when dip buyers piled in, only to get run over shortly thereafter by more selling. The last rally that had started in mid-June seems to have run its course now (data via Ycharts):
Enjoy reading WOLF STREET and want to support it? Using ad blockers – I totally get why – but want to support the site? You can donate. I appreciate it immensely. Click on the beer and iced-tea mug to find out how:
Would you like to be notified via email when WOLF STREET publishes a new article? Sign up here.
![]()
[ad_2]
Image and article originally from wolfstreet.com. Read the original article here.