[ad_1]
The Fed funds rate looks increasingly like 5.00% or above after March 2023
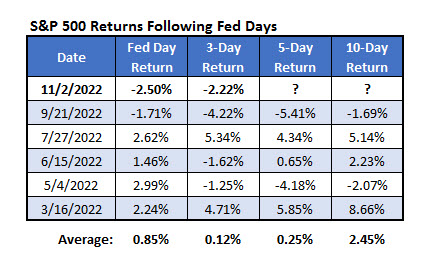
“What about SPX action immediately following FOMC rate hikes this year? …it favors bulls, which I find interesting amid the SPX being down double digits this year.”
– Monday Morning Outlook, Oct. 31, 2022
“It is very premature to be thinking about pausing.., incoming data since our last meeting suggests that the ultimate level of interest rates will be higher than previously expected.”
– Fed Chairman Jerome Powell, Nov. 2, 2022
On Wednesday of last week, as expected, the Federal Open Market Committee (FOMC) raised the fed funds rate for the sixth time this year. The 75-basis point hike matched expectations. But even though the bulls have had the upper hand on the day of an FOMC rate hike and a slight edge in the immediate days following, the bears gained ground with respect to this tendency after last week’s rate hike.
A combination of technical resistance on the S&P 500 Index (SPX – 3,770.55) and Powell’s remarks in his press conference proved too much for bulls to overcome. And initial expectations for when and at what level rate hikes might finally end at next year may have proven to be too optimistic relative to Powell’s remarks. I was surprised by this, because even though Fed governors and recent economic data caused some to speculate that the potential endpoint for rate hikes would be higher than Fed projections after the September FOMC meeting, per the table below from www.cmegroup.com, fed funds futures trading indicated that there was a healthy increase in what level the fed fund rate would be at following the March 2023 meeting.
As you can see, the probability of the fed funds rate being at 5.00% or above after the March 2023 meeting rose from 58% prior to the FOMC meeting to 75% following Powell’s comments. This suggests that a number of market participants were not buying into the between-meetings talk from Fed governors, nor the impact of economic reports subsequent to the September FOMC meeting.
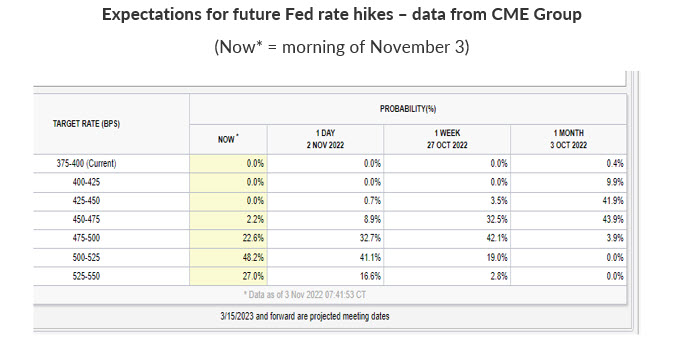
Now, there is more consensus as to the fed funds rate being at 5.00% or above after the March FOMC meeting, but bulls paid a price for this change in expectations.
These probabilities could change again in the days ahead, beginning with this Thursday’s consumer price index (CPI) data, or a combination of Fed speak and other economic data moving forward. For what it is worth, the SPX bottomed in mid-October even as CPI data came in worse than expected.
“… By Friday’s close, the SPX was testing its next area of potential resistance between 3,900 and 3,942. The former represents the breakout level in July above a trendline connecting lower highs since the March peak…the 3,942 level is the site of the SPX’s break below a trendline connecting higher lows from June through mid-September…As we look to potential support, the area where the three-day hesitation occurred last week could be considered the first line of defense…If the previously mentioned support levels fail to hold on pullbacks, this unwinding of pessimism would be at risk of quickly ending…“
– Monday Morning Outlook, Oct. 31, 2022
As I said above, technical resistance was too much for the bulls, per the above excerpt from last week. I bolded this section of the excerpt to highlight what proved to be of utmost importance, which was the 3,900-level acting as a major peak ahead of last week’s sell-off. As you can see on the chart below, this century mark was the sight of a mid-July breakout level above a trendline connecting lower highs from March through June. The 3,900-level then acted as support ahead of a brief, sharp rally in early September, with a break below here later in September marking a precursor to significant weakness into mid-October
Moreover, I couldn’t help but notice how SPX closes prior to Fed meetings in September last week were around the same level – 3,855 – and how, in both instances, the subsequent reactions were the same. If the script follows, we could see further selling into CPI-day this coming Thursday. That said, bulls would like to see the next level of potential support at 3,678 to hold if equites decline this week. The 3,678 level is the SPX’s close on Oct. 17, prior to the gap above the trendline connecting lower highs from mid-August through mid-October.
As a side note, the middle of the month has proven to be a pivot point, marking short-term lows and short-term highs for the past several months.
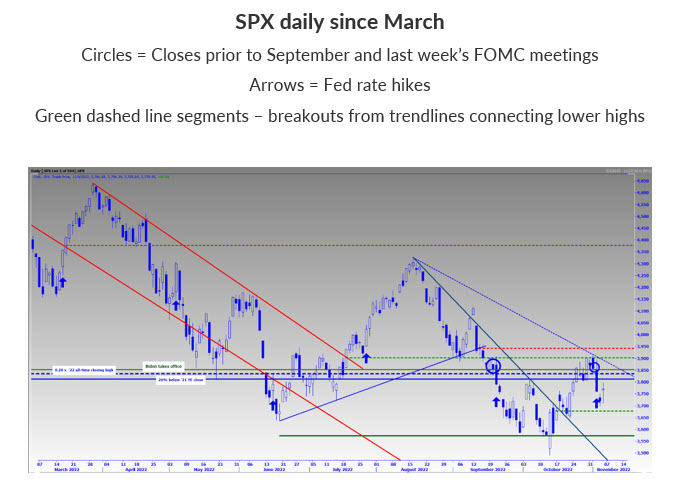
Following the mid-October trendline breakout and a significant peak last week, a question moving forward is: will a new trendline form connecting the August high and this month’s high?
I drew a broken blue trendline through August’s high and last week’s high so you can better visualize this possibility. This is not yet a trendline because it has not connected three or more data points. But it could serve as a useful reference point for gauging potential risk if Thursday’s gap lower proves to be a short-term bottom. This potential trendline will be at 3,855 on Friday and at 3,714 at month end.
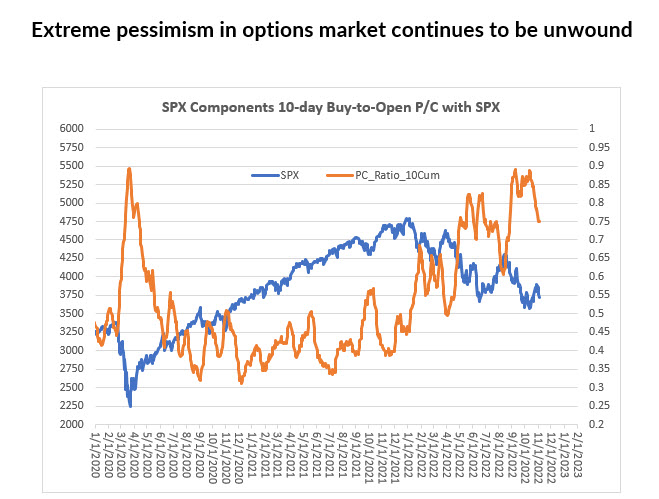
If you are still betting on the negative extreme in sentiment to unwind and thus support equities, a move below 3,678 — the mid-October trendline breakout level — should be your ‘uncle’ point. In the meantime, if you’re looking to commit new money, a meaningful close back above the 3,850-3,855 area could be used as your green light, with 3,855 being the pre-Fed closes in September and last week and 3,850 being the SPX’s close when President Biden took office. Ahead of midterm elections tomorrow, I find this interesting.
Todd Salamone is a Senior V.P. of Research at Schaeffer’s Investment Research
Continue Reading:
[ad_2]
Image and article originally from www.schaeffersresearch.com. Read the original article here.

