

[ad_1]
Contents
A butterfly spread with puts can be used to take directional trades in an uncertain market because they have a great reward-to-risk ratio.
This ratio changes depending on how wide and far away you put the butterfly, which in turn changes the probabilities of success.
Tuning the setup parameters, you can either give your butterfly more positive theta or more positive gamma — both desirable characteristics.
But alas, you can not have both at the same time.
Suppose we purchased the following butterfly on SPY (S&P500 ETF).
Date: May 11, 2022
Price: SPY @ $394.39
Buy one Jun 17 SPY $320 put
Sell two Jun 17 SPY $350 put
Buy one Jun 17 SPY $380 put
Debit: –$405
Target butterflies are symmetrical, and they are for a debit.
This butterfly costs $405, which is the maximum loss we can have on the trade.
The center strikes are at $350.
There is a long strike 30 points above and 30 points below.
We use an all-put butterfly since the butterfly is below the current price.
All the put options are out-of-the-money.
If we had used all calls, the graph would look the same.
But the calls will be “in-the-money,” which we don’t want to avoid the risk of assignment.
The payoff graph below shows that the theoretical potential max profit is $2500.
This is a great reward-to-risk ratio of 6 = $2500/405.
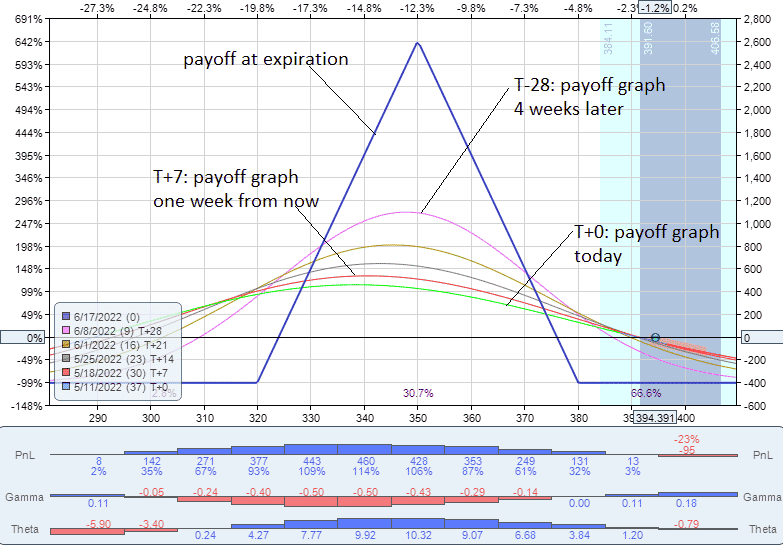
The price is at the dot on the right at $394.
The ideal situation is for the price to slowly move down to $350 at expiration.
We call this “pinning the butterfly” if that happens or comes close.
Since that involves getting the direction, the magnitude of the move, and timing just right, we don’t expect to be able to do this.
And we don’t have to.
The trade can be profitable as long as the price moves towards the center strike.
Deciding when to take profits is a bit of an art.
The longer you wait to take profit, the more you will make if the price is within the payoff graph tent.
Looking at the “T+28 line”, which is the payoff graph 28 days from the start of the trade, we see that our profit would be $1000 if the price is at $350 at that time.
If the price is anywhere between $310 and $385 at T+28, we would have some amount of profit.
The two points are where the T+28 line crosses the horizontal.
This is known as the range of profitability.
The larger the range of profitability, the greater the probability of having a winning trade.
If you hold the trade to expiration (not recommended), you can make nearly $2400 if the price is at $350 at that time.
But if the price is not at $350, you would at least make some profit if it is between $320 and $380 (this is a 60-point range).
At the start of the trade, the range of profitability is the greatest.
At T+0, the range of profitability is from $280 to $390, which is a 110-point range.
The longer you hold the trade, the smaller the range of profitability becomes.
But the longer you hold the trade, the greater the amount of profitability if the price is at the short strike.

For this particular butterfly, the Greeks at the start of the trade are:
Delta: -11.07
Theta: 0.21
Vega: 3.83
Gamma: -0.14
Delta is negative, which makes sense because we profit if the price goes down towards the center strike.
The butterfly is often thought of as positive theta and negative vega strategy, just like the iron condor.
This is true, but only if the price is close to the tent marked by the expiration graph.
In our example, the price is outside the tent at the start of the trade.
When the price is outside or far from the tent, theta is negative, and vega is positive.
I’m not saying that theta and vega switch sign as soon as the price is inside or outside the tent — just roughly speaking.
Hence, we would like the price to head inside the tent as soon as possible to have positive theta decay.
What is interesting is that when theta becomes positive, gamma becomes negative.
And vice versa.
When price moves away from the butterfly and the position goes against us, gamma becomes positive.
Positive gamma is a desirable characteristic to have.
As the position moves against us more and more, each incremental loss we incur will become less and less.
In other words, as we lose, our losses do not accelerate.
This is in contrast to credit spreads (which are negative gamma trades), where if the price goes against us, our losses become greater and greater at a faster rate.
In addition, a typical credit spread can have a max loss that is six times its potential reward.
Our butterfly, as configured, is just the opposite; it has a max loss that is only one-sixth of its potential reward.
The trade-off is that a better risk-to-reward means a lower win rate.
Although, the win rate does depend on when profits are taken.
For the butterfly, the debit paid is the maximum margin requirement.
So it can be an excellent strategy for small accounts, especially if the trader is following the 2% rule.
The 2% rule states that each individual trade should not risk more than 2% of the account value.
If the account size is $25,000, each trade could not risk more than $500.
Our example butterfly with a max risk of $405 is within this 2% rule.
But a typical credit spread picking up a credit of $200 can have a max risk of $800.
This would be beyond the 2% rule for that account.
The nice thing about butterflies is that you can size the butterfly to match your risk parameters by making the butterflies wider or narrower.
Narrow butterflies have lower risk, lower margin requirements, and a lower profit probability.
Wider butterflies are the opposite.
Suppose we have a very wide butterfly like this:
Buy one Jun 17 SPY $300 put
Sell two Jun 17 SPY $350 put
Buy one Jun 17 SPY $400 put
Debit: –$1175
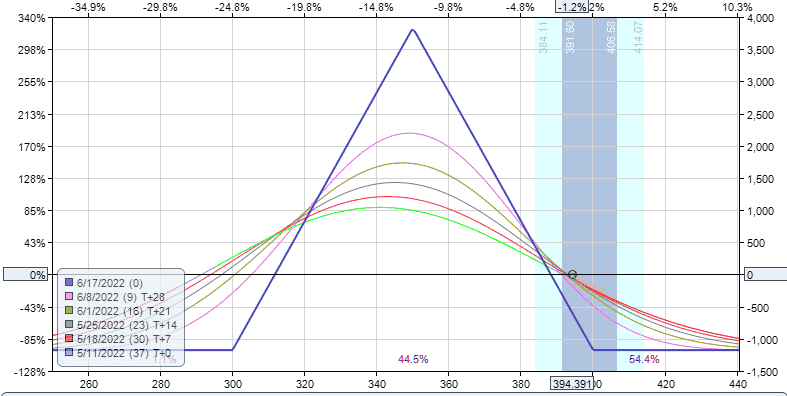
The wider the butterfly, the more it costs.
The max loss for this wide butterfly is $1175.
This is too much for some traders, and they might implement a mental stop if the P&L loses half of that.
Another reason why this butterfly costs so much is that the upper put is “in-the-money”.
Compare where the price dot is in relation to the butterfly.
The ITM puts have intrinsic value, and that is part of the cost.
Because of the larger cost, the reward-to-risk ratio is down to 3 instead of 6 as in the other fly.
What you get for this larger fly is a wider “range of profitability,” which means a high probability of profit.
Price is now close enough to the tent that we now have more theta time decay.
But as we get more positive in our theta, the gamma goes more negative.
Delta: -29.21
Theta: 3.23
Vega: 2.42
Gamma: -0.52
And vice versa.
Positioning the butterfly further away from the current price, you lower your probability of profit, and you have less favorable theta but more favorable gamma.
You need to do enough butterflies to see how P&L changes and how taking profit earlier or later changes your win rate.
Let’s take a look at the P&L of our original example on a day to day basis:
May 12: $81 (20%) May 13: –$83 (-20%) May 16: –$87 (-21%) May 17: –$191 (-47%) May 18: $37 (9%) May 19: $47 (12%) May 20: $0 (0%) trader exits at breakeven
As you can see, even with expiration a month away, the P&L fluctuates quite a lot — although admittedly, this is at a volatile time when the S&P500 is making large moves on a daily basis.
One day the P&L is negative –$191, and the next day it is positive $37.
Because of the large fluctuations, many traders will not use any stops.
Otherwise, they would get stopped out too often.
They will just let the strategy’s max loss at expiration be what they are willing to lose.
The question is, when is a good time to take profits?
One good place to take profit is when the price reaches or comes close to the short strikes, regardless of when that happens.
Another good time is to take profit at “1X”.
If profit reaches one time the max risk, take the profit.
Since we are willing to risk the entire $405, when we see a profit of $405 or more, we take the profit.
That would be a 100% return on the investment.
One can even set a good-to-cancel order to sell the butterfly at $810 credit or better.
This credit will cover our original cost of $405 plus an additional $405 of profit.
On May 17th, when the trade was down –$191, the trader got nervous and changed the order to sell the butterfly at $405 instead.
The trader is thinking, just give me back my $405 that I paid, and I’ll be out of this trade at breakeven.
And guess what?
That order was triggered on May 20 when the butterfly’s value reached $405 intraday.
Looking back at the chart of SPY on May 20.
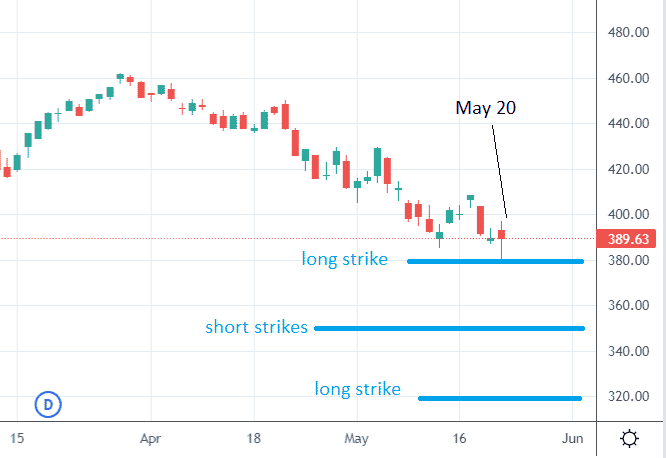
We see a candle with a bottoming tail that came briefly down to the price of $380.
Perhaps this is when the price got close enough to the butterfly to get out at break even.
There was still almost a month left until the butterfly’s expiration.
Did the trader over-react?
As they say, “The market takes money from the impatient to the patient.”
Should the trader have waited longer, and perhaps the price would get down to the $350 short strike and picked up a good profit instead of exiting at breakeven?
Psychology plays a role here.
Seeing the –$191 loss is painful.
Getting out at breakeven relieves the trader of this pain, which was why the exit rule was changed mid-trade.
Whether this was the right decision or not, no one knows.
At the time of this writing, we are at the right edge of the chart.
Perhaps that bottoming-tail was the only chance to get out at breakeven.
Maybe the price just goes up from here and ends in max loss.
When you have only one contract of one butterfly, the decision is “all or nothing.”
But when you have a series of butterflies, you can take partial profit, take partial breakeven, or whatever — as we shall see in the following example.
An investor is looking to enter a bearish position on the downtrend of Advanced Micro Devices (AMD).
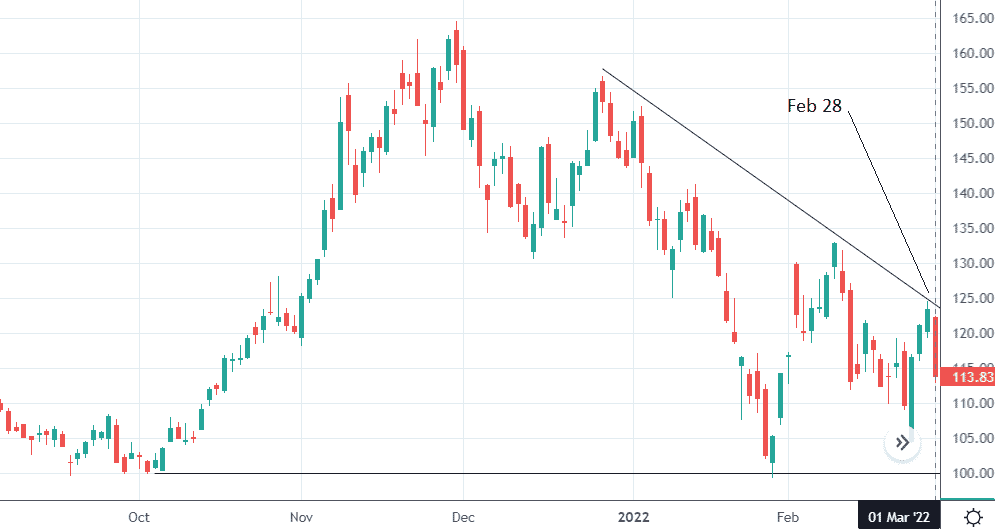
The opportunity arose on February 28 when the price came up to touch the trendline, and the following day gapped down and dropped below the previous day’s low.
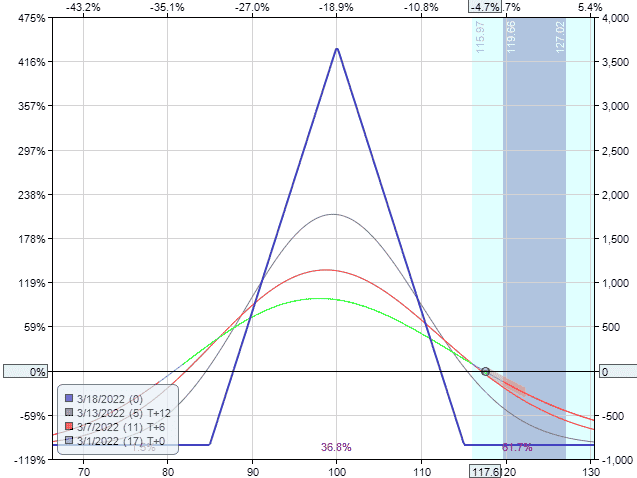
On March 1, the investor entered three butterflies targeting the $100 round number psychological level that had seen previous support in late January and October.
Date: March 1, 2022
Price: AMD @ $117.60
Buy three Mar 18 AMD $85 put
Sell six Mar 18 AMD $100 put
Buy three Mar 18 AMD $115 put
Each butterfly costs $281, making the max risk on the trade $843.
From the risk graph, we see that we can easily make that amount in profit if we get the direction correct.
Because the value of butterflies can fluctuate quite a lot as price and volatility change (sometimes seemingly at random), we put in good-to-cancel orders to take butterflies off as they come into profit.
Ideally, we want to get a 100% return or more on the butterfly.
Since one butterfly costs $281, we will take profit on this one butterfly if it makes $281 in profit.
We put an order to exit the trade for a credit of $562 or better.
If this happens, we would have a “1X” winner.
Some would call this +1R, where R stands for “risk.”
We risk $281, and our profit was $281.
Sometimes the market does not accommodate; depending on the market environment, this may be asking too much.
So we put in another order to take profit on another butterfly if we get at least some profit.
Let’s say we are willing to settle for a 50% return on this second butterfly.
So we put in an order to close another butterfly for a credit of $422.
If we receive a credit of $422 to exit the trade, and we paid $281 to enter the trade, we profit $141.
This is a 50% return on the initial capital invested in this butterfly.
On March 4, this order was triggered, and we exited one of the butterflies for a credit of $422.
Here is the new payoff graph.
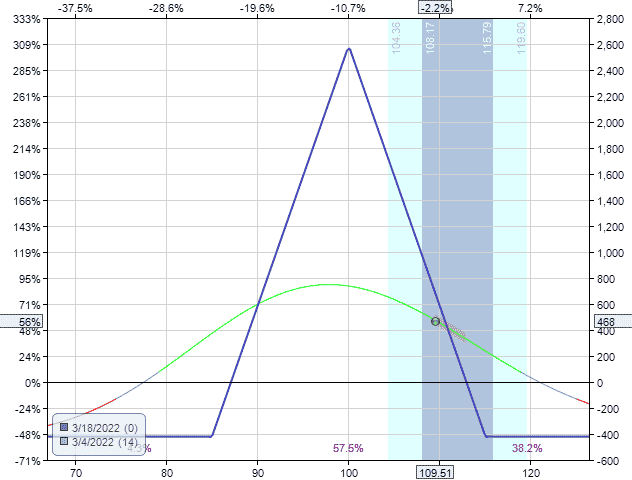
Notice that as we take profitable butterflies off, the net risk in the trade decreases.
The graph shows that our max risk is now $400.
Let’s see if the other order can trigger a 1x winner.
On Monday, March 7, it received a credit of $562 for the second butterfly.
We only have one butterfly left with the payoff graph looking like this.
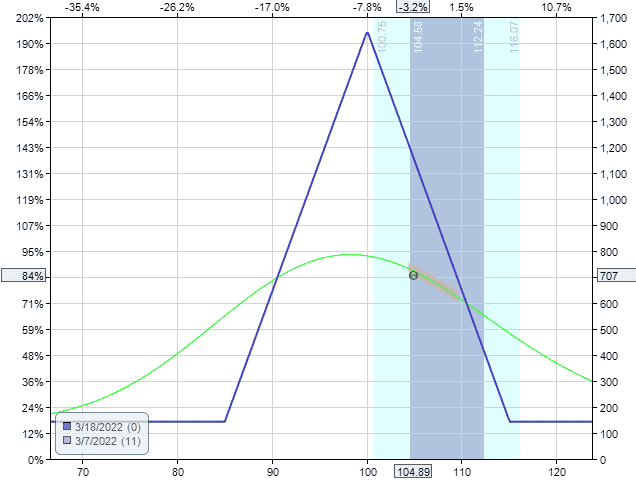
What is our risk in the position now?
We have no risk.
The risk graph is completely above zero.
The credits from the two automatic orders ($562 + $422 = $984) more than paid for the cost of all three butterflies ($843).
This last remaining butterfly, you can manually take off anytime you want.
Known as a “runner,” we let it run as far as we want to see what profits it can come back with.
On March 14, with only four days to expiration, the price is fairly centered in the tent.
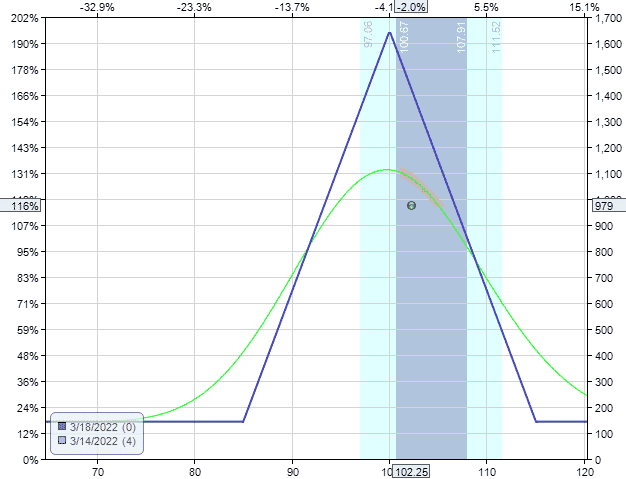
The last butterfly can be taken off for a credit of $835.
In total, the trade gave a profit of $976.
Buy three butterflies: –$843
Exit one for credit: $422
Exit another for credit: $562
Exit last butterfly: $835
Net Profit: $976
At no time in the trade was more than 843 dollars at risk.
It can be said that this trade gave a greater than 1x return.
It returned profits greater than its risk.
Ideally, you would initiate this type of trade only when you have a technical setup that informs you of a greater probability in one direction.
But let’s just assume that we are bad at picking a direction and only get the right direction half the time.
The other half of the time, we experience a max loss.
If we repeat this 100 times, we should still expect a profitable outcome in the long run as long as each win is greater than each loss.
To summarize the monetization scheme used in this example…
If we have three butterflies, and if one of the butterflies has made a 1X profit, you are free to take any positive profits out of the second butterfly.
The third remaining butterfly will be a risk-free trade.
Another monetization scheme is as follows.
If you have three butterflies, try to take two of them off with at least a 50% return on risk.
Then the profits from these two will pay for the cost of the last remaining butterfly, which can become a risk-free trade.
Psychologically, once you have a risk-free trade, you will be able to hold the trade much longer.
As you recall, the longer you hold the trade, the more you can make if the price cooperates.
You might even pin the butterfly.
With a risk-free trade, you will not run into the problem of the first example where the trader took the butterfly off too early with no profits.
If the math is confusing, paper-trade it a few times.
We’ll leave it there so you can go target practice a butterfly spread with puts.
Trade safe!
Disclaimer: The information above is for educational purposes only and should not be treated as investment advice. The strategy presented would not be suitable for investors who are not familiar with exchange traded options. Any readers interested in this strategy should do their own research and seek advice from a licensed financial adviser.

[ad_2]
Image and article originally from optionstradingiq.com. Read the original article here.