
[ad_1]
Yurchello108/iStock via Getty Images
This dividend exchange-traded fund (“ETF”) article series aims at evaluating products regarding the relative past performance of their strategies and quality of their current portfolios. As holdings and their weights change over time, reviews may be updated when necessary.
IHDG strategy and portfolio
The WisdomTree International Hedged Dividend Growth ETF (NYSEARCA:IHDG) has been tracking the WisdomTree International Hedged Quality Dividend Growth Index since 05/07/2014. As of writing, it has 245 holdings, a 12-month distribution yield of 4.54%, and a total expense ratio of 0.58%.
As described WisdomTree, the underlying index:
“is comprised of the top 300 companies from the WisdomTree International Equity Index with the best combined rank of growth and quality factors. The growth factor ranking is based on long-term earnings growth expectations, while the quality factor ranking is based on three year historical averages for return on equity and return on assets. Companies are weighted in the Index based on annual cash dividends paid.”
The index also aims at “neutralizing exposure to fluctuations between the value of foreign currencies and the U.S. dollar.”
IHDG is mostly invested in developed markets. The U.K. comes first in country weight, with 17.5% of asset value. Japan, Switzerland, France and Australia are above 10%. The next chart plots the top 10 countries, for an aggregate weight of 90%. China and Hong Kong weigh about 1.7% together, so direct exposure to geopolitical and regulatory risks is low.
IHDG countries (chart: author: data: WisdomTree)
The top four sectors are quite balanced: healthcare, consumer discretionary, materials and industrials are between 17.8% and 22.2%. Other sectors are below 11% individually and 24% in aggregate.
IHDG sectors (chart: author: data: WisdomTree)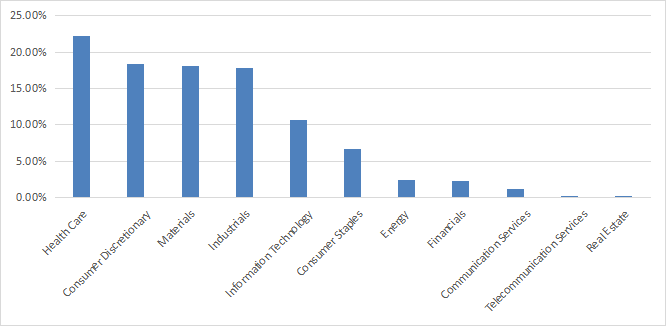
The top 10 holdings, listed below with yields and other ratios, represent 41.6% of asset value. The heaviest one weighs about 6%, so risks related to individual stocks are moderate.
|
Name |
Identifier |
Weight % |
|
Novo Nordisk A/S |
NOVOB DC |
6.06% |
|
LVMH Moet Hennessy Louis Vuitton SE |
MC FP |
5.79% |
|
Roche Holding AG |
ROG SW |
5.48% |
|
BHP Group Ltd |
BHP AU |
4.79% |
|
Rio Tinto Plc |
RIO LN |
4.38% |
|
Anglo American PLC |
AAL LN |
4.35% |
|
Diageo PLC |
DGE LN |
3.20% |
|
Industria de Diseno Textil |
ITX SM |
3.14% |
|
Deutsche Post Ag-Reg |
DPW GR |
2.31% |
|
Tokyo Electron Ltd |
8035 JT |
2.14% |
IHDG vs. international dividend growth ETFs
The next table compares the fund’s performance and risk metrics with three non-hedged international ex-US dividend growth funds: the Invesco International Dividend Achievers ETF (PID), the WisdomTree Global ex-U.S. Quality Dividend Growth ETF (DNL), and the Vanguard International Dividend Appreciation ETF (VIGI) since VIGI inception in 2016. IHDG is a winner in annualized return and risk-adjusted performance (Sharpe ratio).
|
since March 2016 |
Total Return |
Annual Return |
Drawdown |
Sharpe ratio |
Volatility |
|
IHDG |
71.07% |
8.60% |
-30.48% |
0.63 |
13.18% |
|
PID |
59.95% |
7.48% |
-43.36% |
0.43 |
17.98% |
|
DNL |
57.52% |
7.23% |
-31.64% |
0.45 |
15.80% |
|
VIGI |
51.00% |
6.54% |
-29.73% |
0.44 |
13.76% |
Data calculated with Portfolio123
IHDG is second behind PID in year-to-date performance (next chart).
IHDG vs. competitors YTD (Portfolio123)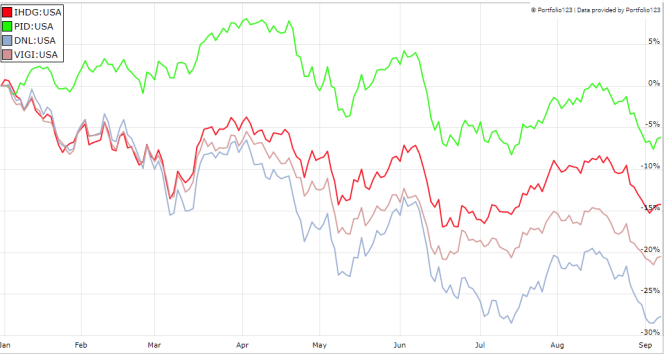
IHDG vs. international high-yield ETFs
The next table compares IHDG with 3 high-yield global ETFs since March 2016: the First Trust Dow Jones Global Select Dividend ETF (FGD), the SPDR S&P Global Dividend ETF (WDIV), the Global X SuperDividend ETF (SDIV). IHDG leads the pack once again, by a larger margin.
|
since March 2016 |
Total Return |
Annual Return |
Drawdown |
Sharpe ratio |
Volatility |
|
IHDG |
71.07% |
8.60% |
-30.48% |
0.63 |
13.18% |
|
FGD |
32.08% |
4.37% |
-43.26% |
0.28 |
18.18% |
|
WDIV |
35.63% |
4.79% |
-40.11% |
0.28 |
16.11% |
|
SDIV |
-23.42% |
-4.02% |
-56.62% |
-0.13 |
21.76% |
The next chart plots the same funds year-to-date and adds the Schwab International Dividend Equity ETF (SCHY), launched in April 2021. IHDG comes second after WDIV.
IHDG vs. high-yield funds YTD (Portfolio123)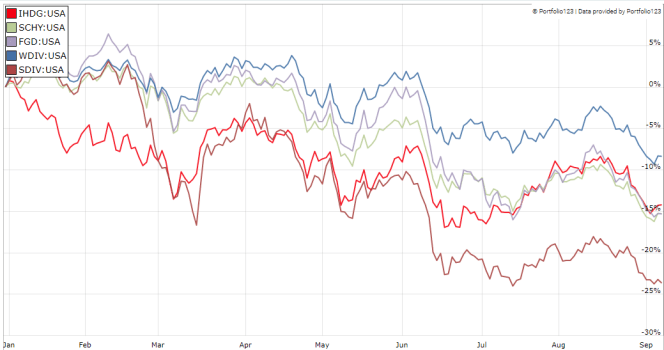
SDIV has the highest yield and the worst performance, showing once again the risks of high-yield funds. I have pointed out in several ETF reviews that securities with yields above 6% suffer from capital decay on average (there are rare exceptions).
Pros and cons of the currency hedge
IHDG is designed to mitigate risks of local currencies going down for shareholders who spend and invest most of their money in U.S. dollar. However, hedging has a cost, and it may increase risks for investors with another base currency by adding a hidden exposure to the dollar in their portfolio. Currency hedging usually becomes a drag if the dollar index goes down. Investors seeking exposure to global equities with a bearish or neutral opinion on the dollar index may prefer non-hedged international funds with cheaper management fees.
Takeaway
IHDG holds 245 international dividend stocks with growth and quality characteristics. Moreover, it aims at neutralizing exposure to foreign currencies for dollar-based shareholders. A number of currency trades are embedded, with pros and cons. IHDG is well diversified: the heaviest sector represents 22.2% of asset value, the heaviest country weighs 17.5% and the largest holding weighs 6.1%. IHDG has beaten its international dividend growth competitors since 2016 and is second behind PID in 2022 to date. IHDG volatility and drawdown point to a lower risk than high-yield funds. For transparency, a dividend-oriented part of my equity investments is split between a passive ETF allocation and my actively managed Stability portfolio (14 stocks), disclosed and updated in Quantitative Risk & Value.
[ad_2]
Image and article originally from seekingalpha.com. Read the original article here.