Yes, I’m very familiar with that old Wall Street adage, “Don’t Fight The Fed!” But similar to the “Go Away In May” theory, I’m happy to poke holes in it. Rather than just blindly buy what the media is selling, I do research. There is plenty of history to support the notion of remaining invested while the Fed does its thang.
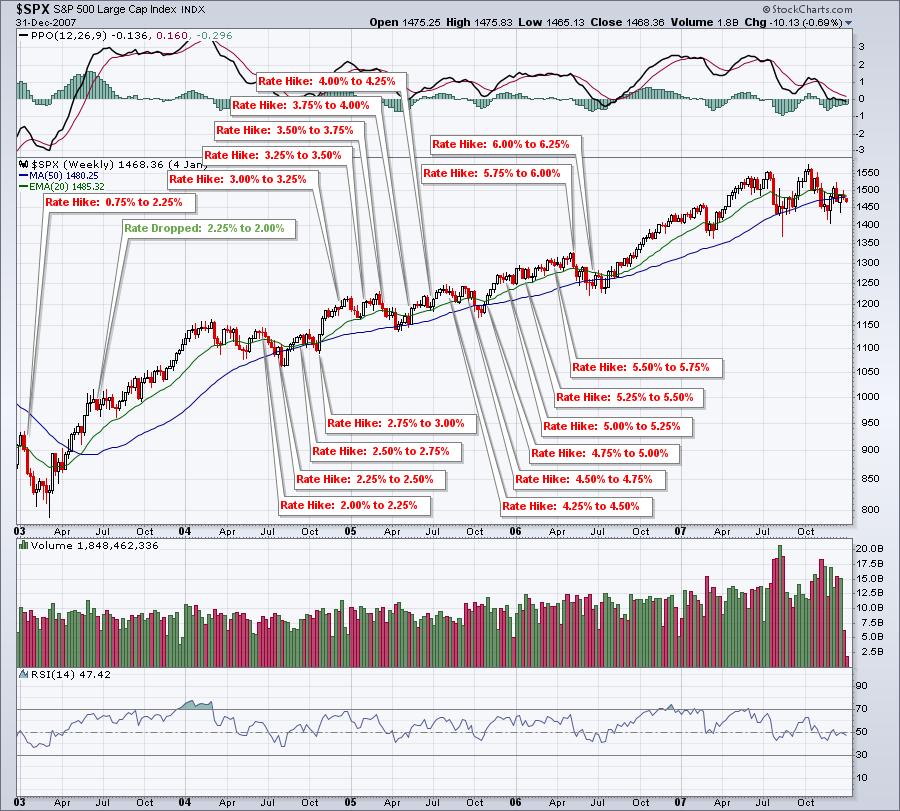
Remember the secular bear market of the 2000s? The dot-com bubble burst in the very early 2000s and, as we recovered, the Fed went on a rate-hiking rampage. They raised rates at 17 consecutive meetings! The first of those rate hikes was in June 2004. They didn’t hit the brakes until after their 17th hike in June 2006. That was 2 years of rate hike after rate hike. At the time of the first rate hike, the fed funds rate was at 2.00%, a historically-low level.
Want to see how the S&P 500 fared during this two-year period of rate hikes:
It wasn’t exactly an explosion higher in the S&P 500, but there were plenty of investors/traders willing to fight the Fed. And they won.
One other very significant period in history where investors had no problem handling the Fed “mano y mano” was the 1960s. There were plenty of rate hikes and a few recessions, but, in the end, the secular bull market won out. In April 1961, the fed funds rate was near zero and access to money was easy. We were a decade into a secular bull market (this sound familiar?). The Fed went on a rate-raising campaign that took rates to 6% by October 1966. That’s a MASSIVE amount of rate hiking in 5+ years. Yet I’d like for you to look at the S&P 500’s performance using a weekly chart that covers this period:
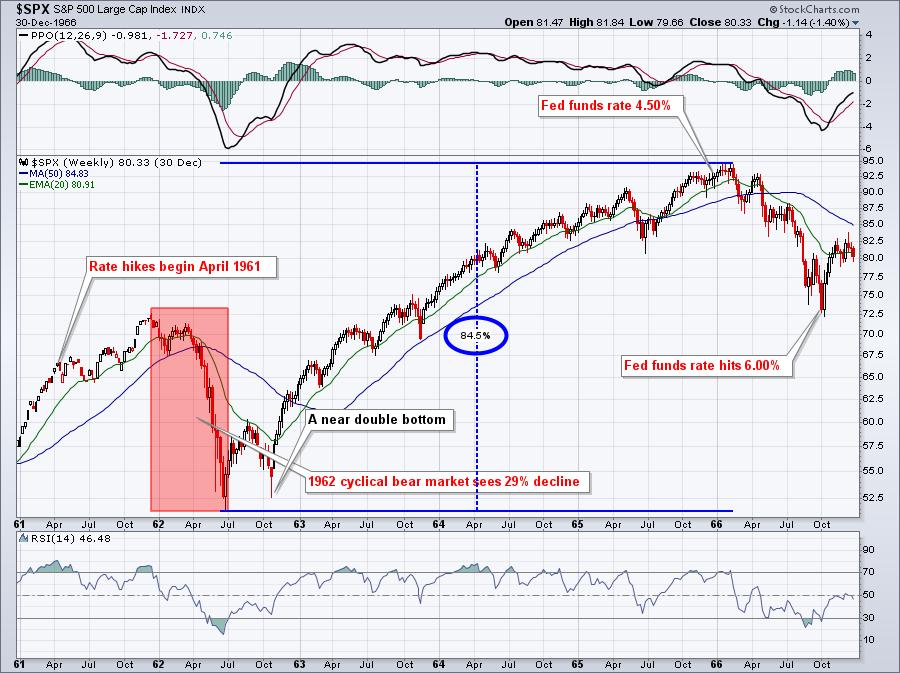
During that 1962 cyclical bear market, the S&P 500 lost 29% and fell for 6 1/2 months – very comparable to our 2022 cyclical bear market. This year, the S&P 500 lost 25% and dropped for 5 1/2 months.
I believe there’ll be times to fear the Fed, but not when the fed funds rate still sits at 2.25%-2.50%.
Fear the media, not the Fed. The media will state ANYTHING to gain more clicks. The more fearful the headlines, the more clicks they get. Therefore, if we question the media, we should be afraid of HYPER inflation, higher rates, the Fed, the war in Ukraine, the chip shortage, the time of year, politics, weather in the Baltic Sea, lunar eclipses, and ____________ (fill in the blank). Fear sells.
I simply tune out ALL of the noise and follow the charts, including rotation, intermarket relationships, historical trends, and the like. Wall Street builds large positions in their favorite stocks during tumultuous periods like the one we’ve endured in 2022. Don’t believe me?
Here’s how the QQQ (ETF that tracks the NASDAQ 100) has traded since its closing high on November 19, 2022 and through Friday, September 2nd:
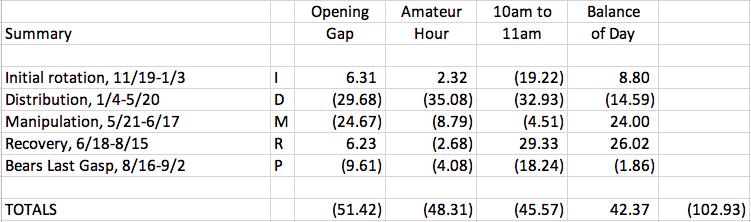
I’ve broken the trading down by period/phase of the cyclical bear market and by time of the day. My belief is that we are all manipulated at the opening bell and during the first 30-90 minutes of trading. Price is what it is, but how we get there is important. The clear “bearish” period was 1/4 through 5/20 as every period of the trading day saw distribution. In other words, there was selling at all times of the day. When Wall Street first began exiting stocks during the initial rotation phase, there were still opening gaps higher and early morning strength as retail traders continued to do as they had done for nearly two years – BUY, BUY, BUY! Meanwhile, Wall Street began selling into this buying. This behavior was also confirmed by the MASSIVE rotation into defensive stocks during December 2021. Note the “recovery” phase from 6/18 to 8/15 and how the QQQ traded. There was very little strength at the opening bell and during the first 30 minutes of trading. But the accumulation throughout the balance of the day was rather obvious. I also calculated the performance by sector during this period. Here’s the order, best sector to worst sector:
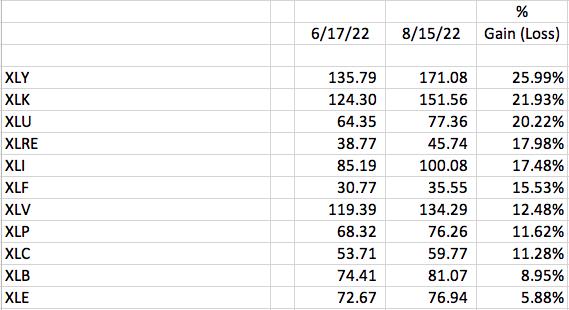
Consumer discretionary (XLY) and technology (XLK) led the recovery phase, unlike the initial rotation and distribution phases, when Wall Street was jumping ship.
The manipulation in 2022 has been extreme based on my research. In Monday’s EB Digest, I plan to feature a software company that lost 139 bucks (more than 80% of its value) since its November 19, 2021 close, yet, on a net basis, fell just 1 dollar after 11am ET. It was all gap downs and early morning selling. During 5 hours (11am-4pm ET) of the 6 1/2 hour trading day, the stock lost nothing. If you’d like to see the stock and read more about it, CLICK HERE to sign up for our FREE EB Digest. There is no credit card required and you may unsubscribe at any time.
Also, be sure to “subscribe” to my Trading Places blog by providing your email in the area provided below. There’s no cost and, by subscribing, my articles will be sent directly to your email as soon as I publish them.
Happy trading!
Tom