

[ad_1]
Nasdaq 100, ASX 200, Nikkei 225, Earnings Season, US Jobless Claims, Technical Analysis – Asia Pacific Indices Briefing
- Nasdaq 100, tech stocks sink as another central bank becomes more hawkish
- Australia’s ASX 200 vulnerable to Chinese lockdowns, slowing global growth
- Will China CPI data keep the PBOC on its toes amid stimulatory measures?
Thursday’s Wall Street Trading Session Recap
Sentiment on Wall Street continued to improve, with Thursday’s price action adding to the recovery in stocks since the middle of June. Nasdaq 100, S&P 500 and Dow Jones futures are up about 4.5%, 3.11% and 2.25% this week so far respectively. On a monthly basis, the tech-heavy Nasdaq 100 is heading for its best performance since November 2020.
The rosy mood on Wall Street continued tracking what has been a relatively upbeat earnings season so far. On average, companies in the S&P 500 have surprised 1.01% and 4.43% in sales and earnings respectively – according to Bloomberg. Over the past 24 hours, the best sectors in the S&P 500 were consumer discretionary (2.25%), health care (1.51%) and information technology (1.41%). Energy (-1.69%) lagged with crude oil prices.
Further contributing to the cheery sentiment was, counterintuitively, worse-than-expected US jobless claims data. The 2-year Treasury yield fell 4.34% on Thursday, the most since the middle of June. Meanwhile, market expectations of Federal Reserve rate cuts in 2023 increased. Traders are almost pricing in 2 by the end of next year. This likely sent stocks higher.
S&P 500 Sector Breakdown 7/21/2022
Data Source: Bloomberg
Nasdaq 100 Technical Analysis
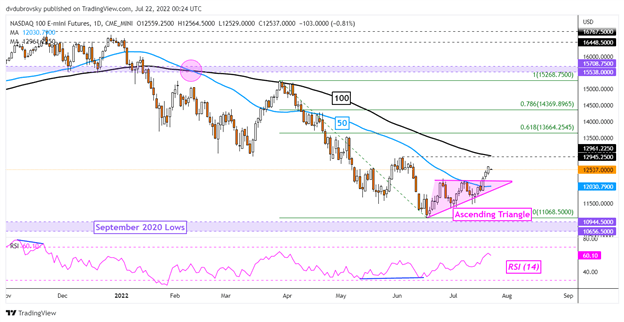
The Nasdaq 100 continues to make upside progress after breaking above an Ascending Triangle chart pattern. Now, the index is quickly approaching key resistance. This seems to be a combination of the June high (12961) and the 100-day Simple Moving Average (SMA). If these hold, a pivot lower might be in the cards.
Nasdaq 100 Futures Daily Chart
Friday’s Asia Pacific Trading Session
Friday’s Asia-Pacific trading session is lacking notable economic data. This is placing the focus for traders on general risk appetite. As such regional indices, such as Australia’s ASX 200 and Japan’s Nikkei 225, may follow in the footsteps of Wall Street. That would set things up for a continuation in risk appetite heading into the weekend.
ASX 200 Technical Analysis
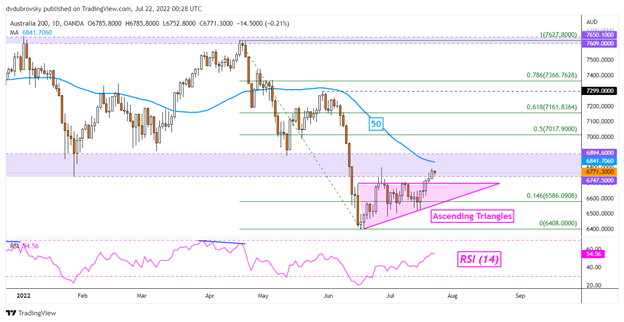
The ASX 200 has also confirmed a breakout above an Ascending Triangle. This is opening the door to further gains. The 50-day SMA is just above which may hold as resistance, perhaps pivoting the index lower. Otherwise, further gains expose the midpoint of the Fibonacci retracement at 7017.
ASX 200 Daily Chart
Nikkei 225 Technical Analysis
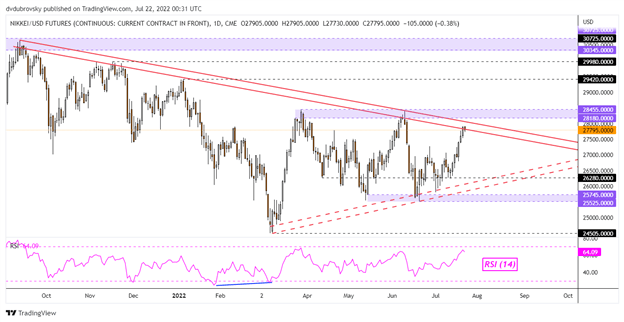
As for the Nikkei 225, the index finds itself sitting on a long-term falling trendline from the Fall of 2021. Breaking above may not leave things in the clear as the 28180 – 28455 resistance zone is nearby. Breaking above this zone would likely be the bullish confirmation of resuming gains since February.
Nikkei 225 Daily Chart
— Written by Daniel Dubrovsky, Strategist for DailyFX.com
To contact Daniel, use the comments section below or @ddubrovskyFX on Twitter
[ad_2]
Image and article originally from www.dailyfx.com. Read the original article here.