

[ad_1]
Among the underlying components of the Russell 3000 index, we saw noteworthy options trading volume today in Boot Barn Holdings Inc (Symbol: BOOT), where a total of 5,126 contracts have traded so far, representing approximately 512,600 underlying shares. That amounts to about 87.7% of BOOT’s average daily trading volume over the past month of 584,345 shares. Especially high volume was seen for the $60 strike put option expiring January 20, 2023, with 2,507 contracts trading so far today, representing approximately 250,700 underlying shares of BOOT. Below is a chart showing BOOT’s trailing twelve month trading history, with the $60 strike highlighted in orange:
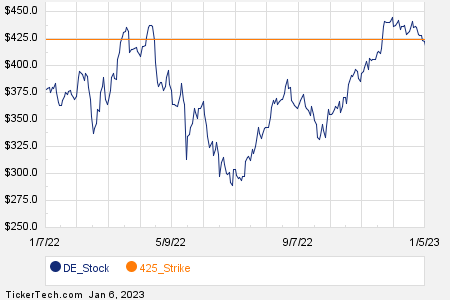
Deere & Co. (Symbol: DE) saw options trading volume of 11,327 contracts, representing approximately 1.1 million underlying shares or approximately 87.2% of DE’s average daily trading volume over the past month, of 1.3 million shares.
Particularly high volume was seen for the $425 strike put option expiring January 06, 2023, with 692 contracts trading so far today, representing approximately 69,200 underlying shares of DE. Below is a chart showing DE’s trailing twelve month trading history, with the $425 strike highlighted in orange:
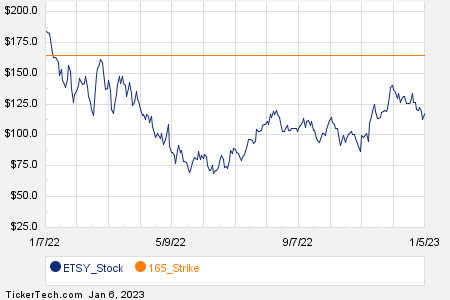
And Etsy Inc (Symbol: ETSY) options are showing a volume of 22,302 contracts thus far today. That number of contracts represents approximately 2.2 million underlying shares, working out to a sizeable 87.2% of ETSY’s average daily trading volume over the past month, of 2.6 million shares.
Especially high volume was seen for the $165 strike put option expiring January 20, 2023, with 2,810 contracts trading so far today, representing approximately 281,000 underlying shares of ETSY. Below is a chart showing ETSY’s trailing twelve month trading history, with the $165 strike highlighted in orange:
For the various different available expirations for BOOT options, DE options, or ETSY options, visit StockOptionsChannel.com.
Also see:
SIMO Dividend History
FMC Stock Split History
Funds Holding TSJA
The views and opinions expressed herein are the views and opinions of the author and do not necessarily reflect those of Nasdaq, Inc.
[ad_2]
Image and article originally from www.nasdaq.com. Read the original article here.