

[ad_1]
Straddles could be the way to play conflicting oil sector signals
On Tuesday, June 5, crude oil clocked its first print below $100 per barrel since May 11, sending black gold to trade at its lowest level since March. To add insult to injury, oil & gas stocks are entering a historically bearish month and quarter. Is there any silver lining to be gleaned from the energy sector at the moment?
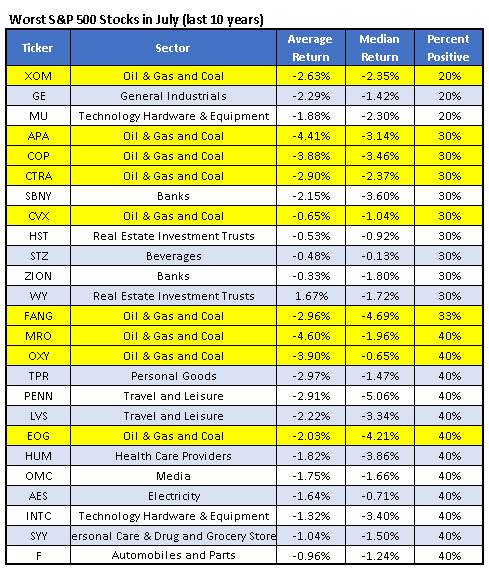
Every month, Schaeffer’s Senior Quantitative Analyst Rocky White compiles a list of the 25 worst-performing stocks on the S&P 500 Index (SPX) in the last 10 years. Per the table below, oil & gas equities are comprised of nine of the 25 worst performers for July. This includes heavy hitters like Exxon-Mobil Corp (NYSE:XOM), Occidental Petroleum Corporation (NYSE:OXY), and Marathon Oil Corporation (NYSE:MRO), with respective average losses of -2.6%,-3.9%, and -4.6%.
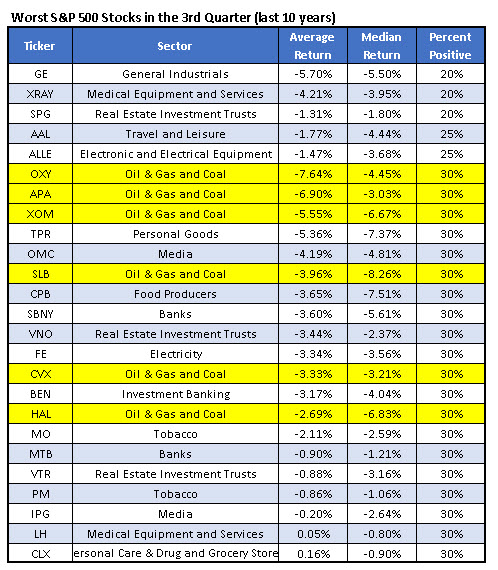
White compiled a similar list for the third quarter in the last decade. There are six oil stocks on the list, the most of any sector by a wide margin. Notable names below include Chevron Corporation (NYSE:CVX), with an average quarterly loss of 3.3%, with only three positive quarters in the last 10 years. It’s a similar story for the VanEck Vectors Oil Services ETF (NYSEARCA:OIH), which averages a -1.9% loss in July and a -6.2% deficit in the third quarter, historically, in the last decade.
Prudent contrarian investors –especially in options trading — should of course not rely on seasonal quantitative analyses alone. Context regarding historical volatility is critical. Prior to this summer’s technical breakdown, oil & gas stocks and had been mostly spared from the brunt of the 2022 selloff. Another study compiled by White offers a way for oil-stock inclined options traders to potentially profit from a period of bearish seasonality.
First, White created hypothetical call and put options which are exactly at the money and expire in exactly 21 trading days. The table below then takes real options to get an implied volatility for those hypothetical options, and with that, we can find the prices we can expect these options to trade at. Using these hypothetical options, assume a trader purchased a straddle on each ticker (so, they buy the call and the put option). Then we look at the returns a trader would get had they purchased one of these straddles every single day and held them until the hypothetical expiration day. Below is an example of some oil & gas names that popped up on this scorecard.
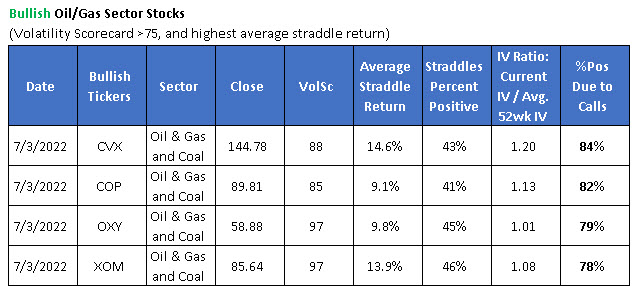
Looking back the past year, the data in the table above tells us the expectation we’d have if we purchased a straddle on these tickers. For CVX, the straddle that expired in 30 days had an average return of 14.6%. The straddle had a 43% chance of being positive, which is relatively high considering for a straddle to be in the black, it needs to move in one direction enough to cover the premium of a call option and a put option. The last column tells us that out of all the positive straddles, 84% of them were positive because of the call option. In other words, CVX has been quite bullish over the past year.
This tells us is CVX has tended to make big moves relative to their option prices, and typically big in the up direction. Straddles have worked over the past year and can be profitable in either direction. So while oil stocks such as CVX enter a historically bearish period, their 12-month performance indicates they might make good straddle plays. This is because even if you get weakness from these stocks, which has historically been the case, you can still profit. But if some of these oil stocks continue higher like over the past year, you can still profit.
Conversely, if a trader thinks these stocks will be as weak as they have been in the past during the next few months, they can buy puts for a bigger return than the straddle knowing the options have been underpriced over the past year.
Subscribers to Chart of the Week received this commentary on Sunday, July 10.
[ad_2]
Image and article originally from www.schaeffersresearch.com. Read the original article here.