

[ad_1]
Torsten Asmus
Thesis
We believe investors in Oxford Lane Capital (NASDAQ:OXLC) need to develop an intuition with price action, as its long-term total returns belie the strength in its distribution yield, given the secular downtrend in its net asset value (NAV).
As a result, its seemingly high distribution yield doesn’t capture the capital depreciation reflected in OXLC’s long-term downtrend. Hence, investors are encouraged to assess the performance of OXLC through the total return framework (which encompasses its distribution yield).
Therefore, the right way to navigate with a higher probability of success in stocks/funds with long-term downtrends is to go on the short side. Counter-trend opportunities exist but should be limited to capitulation type of moves as seen on its long-term chart.
We have yet to glean any attractive opportunity for investors to either go long or short on OXLC at the current levels. Therefore, we urge investors to be patient and wait for the right opportunity to arrive.
Wait For The Right Opportunity To Go Long/Short
We believe investors in OXLC are well aware of the attendant risks involved with closed-end funds that invest in securitization vehicles consisting of debt securities that are unrated or rated below investment grade.
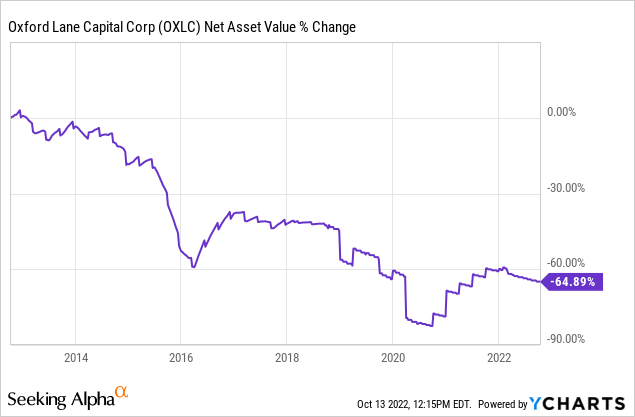
OXLC’s NAV is also in a secular downtrend, posting a decline of nearly 65% over the past ten years, as seen above.
OXLC price chart (monthly) (TradingView)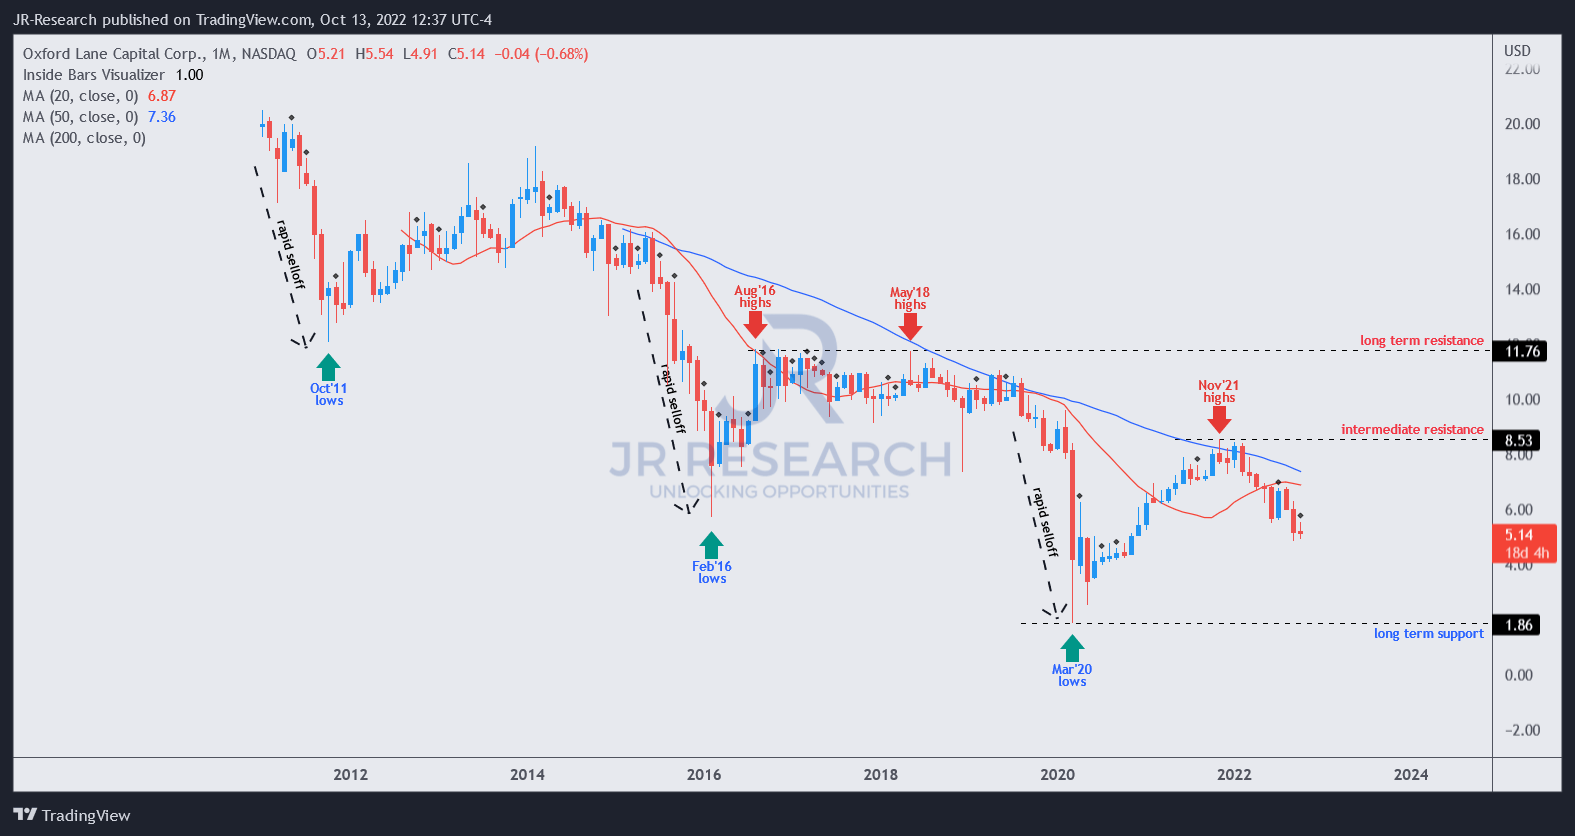
But, simply knowing that OXLC has a declining NAV doesn’t help investors to pick the right opportunities for higher probability setups with the fund. Hence, we believe investors should consider the price action in OXLC carefully to help them analyze the appropriate long/short opportunities.
Given OXLC’s decline in its NAV over time, investors shouldn’t be stunned that OXLC has a long-term downtrend, as seen above. Trend-following investors know that the right way to win in the long run for secular downtrend stocks is to follow the trend!
Using price action analysis helps investors to discern the appropriate resistance zone and bearish reversal setups to pick higher probability entry levels to short OXLC and ride the downtrend bias. Remember, the trend is your friend until it’s not. For now, we have yet to see anything under the hood that suggests otherwise.
As seen above, the 50-month moving average has been a reliable dynamic resistance level preventing further buying upside from reversing its long-term bearish bias. Hence, investors considering short setups can consider using the 50-month moving average as a resistance zone to execute their trades, leveraging on appropriate bearish reversal price action.
OXLC’s most recent re-test of its 50-month moving average was in November 2021. Currently, we have not observed any appropriate short setups with an attractive reward-to-risk profile for investors to enter.
In contrast, investors who choose to go long need to be very patient. As seen above, there were three excellent opportunities for long-only investors to capitalize on significant capitulation moves over the past ten years. To partake in long-only counter-trend opportunities for OXLC, we urge investors to be highly selective and consider only “capitulation-like” setups to improve their reward-to-risk profile.
These capitulation moves were often preceded by rapid, vertical-like selloffs, followed by a subsequent bullish reversal price action. To further aid investors in corroborating the price action dynamics, we encourage investors to add the BofA high-yield spreads chart to their tool kit.
BofA High yield spreads % (monthly) (TradingView)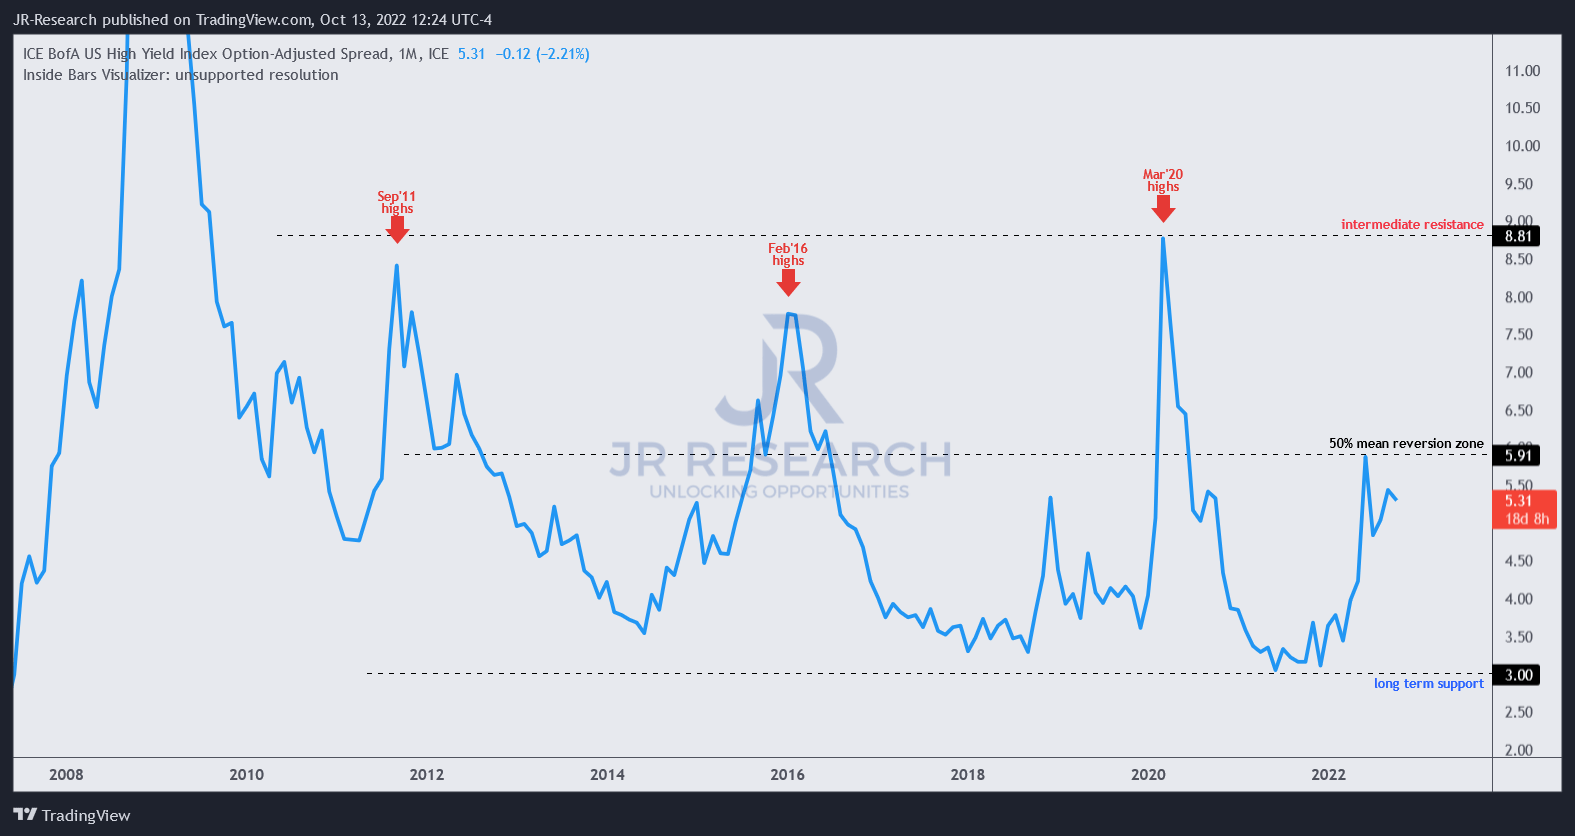
As seen above, the significant lows seen in OXLC’s price chart correspond with significant topping signals in BofA’s high yield spreads over the past ten years.
Currently, with a spread of just 5.3%, it’s even below the 50% mean-reversion mark between its long-term support and intermediate resistance. Furthermore, OXLC’s price action has not demonstrated any capitulation move in its long-term chart, indicating significant market panic over high-yield debt.
Is OXLC Stock A Buy, Sell, Or Hold?
We have yet to glean a robust long/short opportunity in OXLC through its price action. Hence, we urge investors to bide their time and wait on the sidelines.
Despite posting a distribution yield of more than 17%, OXLC posted a YTD total return of -26.15%. Hence, we believe investors must consider OXLC’s price action and its performance from a total return framework when considering adding exposure.
As such, we rate OXLC as a Hold for now.
[ad_2]
Image and article originally from seekingalpha.com. Read the original article here.