Talk about being a party pooper. Fed Chair Powell’s comments today that bringing down prices “is likely to require a sustained period of below-trend growth and an increase in unemployment” brought the markets to its knees. The remarks increased fears of a prolonged rate-hike cycle which, in turn, pushed stocks sharply lower.
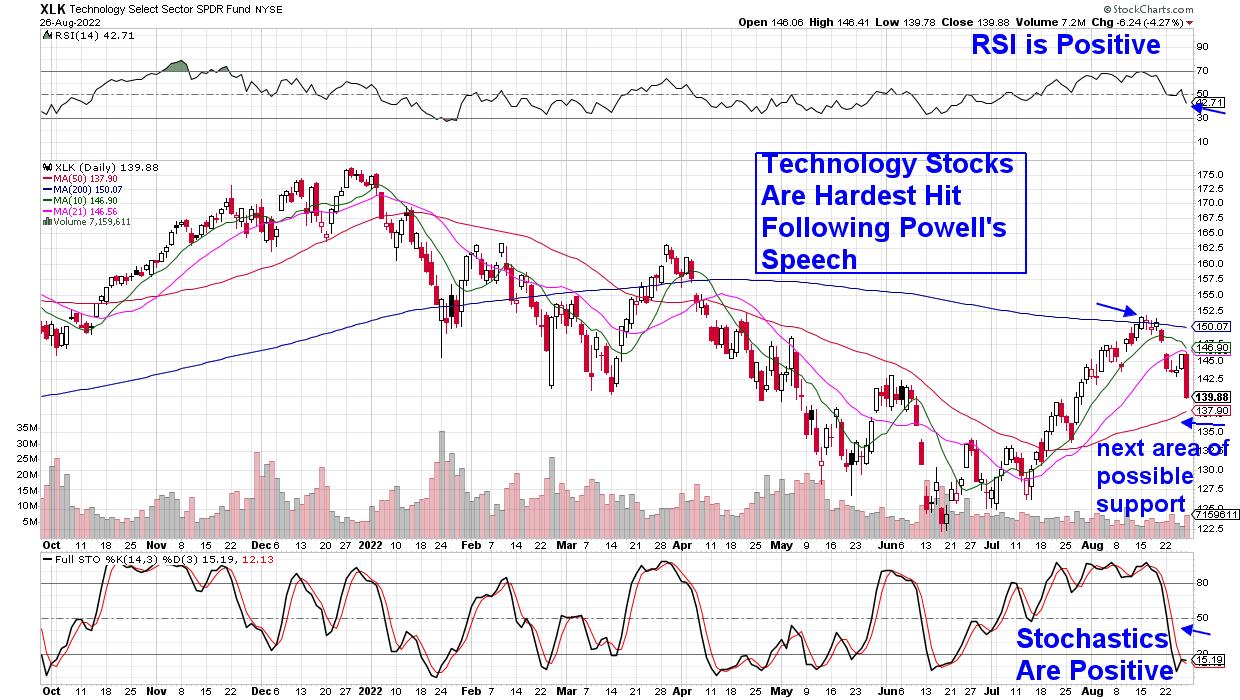
Hardest hit were Technology stocks, which fell 4.3% today, a loss that underscored the inability of this sector to break back above resistance at its 200-day moving average last week.
DAILY CHART OF TECHNOLOGY SECTOR:
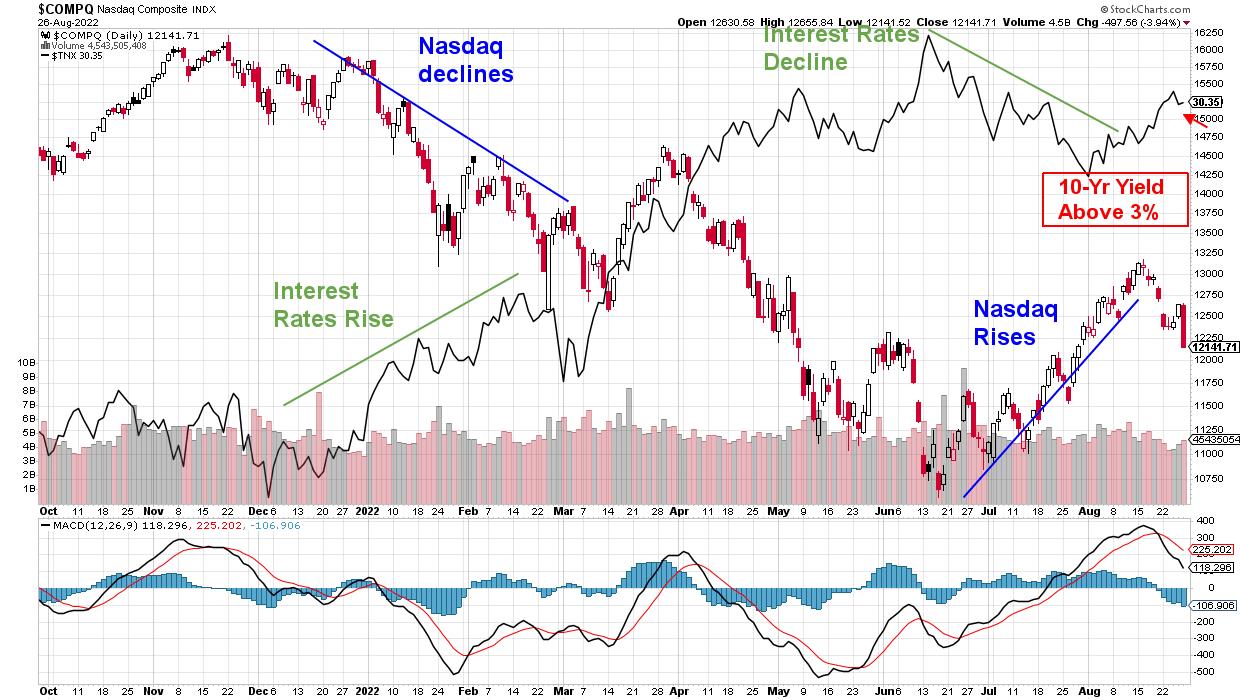
In a rising-rate environment, Growth stocks such as Technology, as well as Consumer Discretionary (to name just two areas), stand to lose the most, as higher rates reduce the value of future earnings. The chart below shows the Tech-heavy Nasdaq’s performance as interest rates ebb and flow and quite clearly, higher yields are a negative.
DAILY CHART OF NASDAQ WITH YIELD OF 10-YEAR TREASURY OVERLAY
This week’s pullback has pushed the S&P 500 below a key level and, with its momentum indicators in negative territory on the daily chart, the near-term outlook for the markets does not look good. Subscribers to my MEM Edge Report were alerted to this possibility in recent reports, as we trimmed stocks from our buy list and highlighted industry group charts that were weakening.
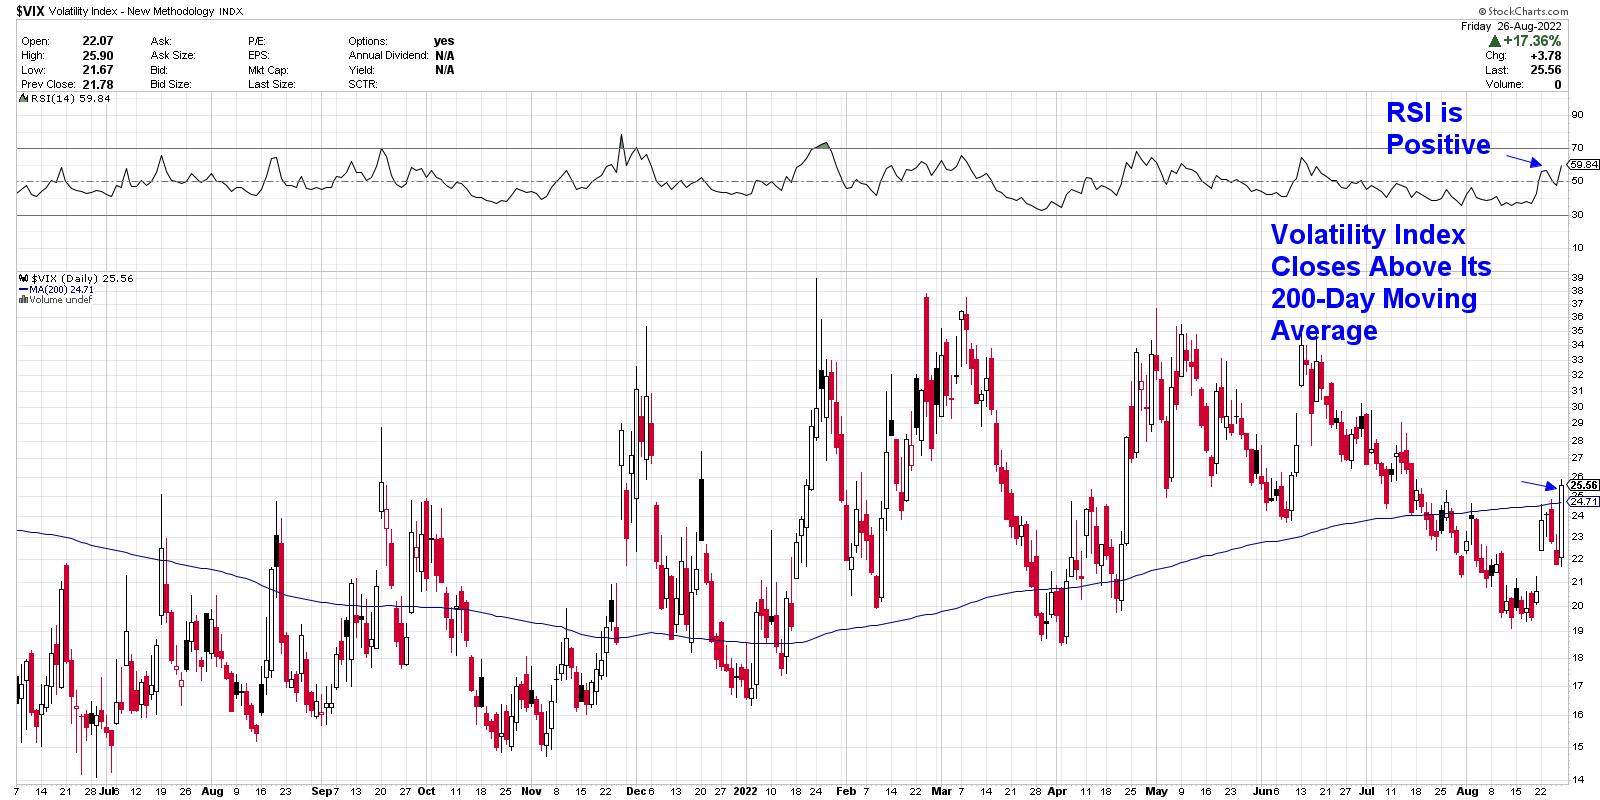
Powell’s clear message today that businesses and households may feel some pain in the coming months was quite different from his normally more balanced remarks. The tone increased anxiety among investors and caused a sharp uptick in the volatility index ($VIX) — also known as the “fear index.” This is another negative for the markets.
DAILY CHART OF VOLATILITY INDEX (VIX)
As for the prospects for the markets going forward, you can access my Monday Alert Report from this week, where I share key areas of resistance, as well as price action that would put the broader markets back into an uptrend. Also included are marked-up charts of both the Semiconductor and Software groups, with detailed insights into those areas. My Alert Reports are not as detailed as my weekly MEM Edge Reports, so be sure and take a 4-week trial at a nominal fee so you can avoid losses and preserve capital amid a weakened market backdrop.
On this week’s edition of The MEM Edge, now available to watch on demand at StockChartsTV.com and the StockCharts YouTube channel, I share a key level that was broken in the S&P 500 as well as what to be on the lookout for going forward. I also review stocks that are bucking the downtrend and what is driving them higher.
Warmly,
Mary Ellen McGonagle, MEM Investment Research