

[ad_1]
US Stock Market Key Points:
- TheS&P 500, Dow, and Nasdaq 100 pulled back in anticipation of more interest rate hikes
- US Treasury yields jumped to fresh highs this morning, trading at levels not seen in more than two decades despite a deteriorating Housing Sector.
- All eyes are on the FOMC monetary policy decision at 14:00 EST tomorrow. This is a quarterly rate decision, meaning that the Fed will also provide updated guidance and projections.
Most Read: How Will Markets Respond to the September Fed Meeting?
Markets are gearing up in anticipation of tomorrow’s FOMC meeting where a rate hike of 75 basis points is being priced in, which has helped US Treasury yields to continue their move higher. Yesterday’s report highlighted that the two- and ten-year notes were hovering around levels not seen in more than two decades. Today saw the ten-year push well above the 2011 high to close at 3.57%, which helped the USD to remain on track for a fourth consecutive monthly gain.
As a result, U.S. equity indices opened lower on Tuesday and traded down, reversing yesterday’s gains. Given the big event tomorrow, today’s move takes on a look of consolidation before a significant driver comes to light. At the market close, the Dow, the Nasdaq 100 and the S&500 posted losses of 1.01%, 0.90% and 1.12%, respectively. All sectors of the S&P fell but Materials, Consumer Discretionary and Real Estate dragged the index down the most.
While yesterday’s Economic Calendar provided some indications of weakening housing confidence in the context of rising interest rates, today’s better-than-expected August housing starts data would imply an alternative narrative although it is only a single data point. Permits for new construction remained on a downward trend and appears that the previous month’s decrease in mortgage rates may have aided builders in moving inventory. But since then, interest rates have risen considerably, which is usually detrimental to the Real Estate Sector. Today, this component of the S&P 500 index lost 2.57% in expectation of interest rate hikes amid soaring inflation.
Inflation pressures are also impacting auto companies such as Ford. Today, the company said that soaring prices and supply chain disruptions would cost them an extra $1 billion in the third quarter, hence delaying the delivery of certain vehicles into the Q4. At the close, shares of the Ford posted a loss of 12.3% and contributed to the 1.69% decline in the Consumer Discretionary Sector of the S&P 500.
TECHNICAL OUTLOOK
From a technical perspective, there has been a great deal of volatility as liquidity conditions remain relatively low in anticipation of tomorrow’s event risk, the FOMC’s monetary policy announcement.
Yesterday, the S&P 500 exhibited a sustain upward momentum in the last hour of trading but failed to close above the resistance area between 3902-3915. Overnight, investors retested the lower trendline, but bears seized control and today’s decline marked fresh new lows. The subsequent area of support is now seen around 3835-3820.
S&P 500 (ES1) Daily Chart
S&P 500 (ES1) Futures Daily Chart-Prepared Using TradingView
Alternatively, the Nasdaq 100 did not make new lows yesterday and that was the same this morning, as the Nasdaq sits above a major support zone between 11705-11685. This sets the stage for the tech-heavy index into tomorrow’s driver, with the Nasdaq often displaying considerable sensitivity to higher rates and tighter policy. The fact that higher lows have printed for each of the past two days, remains an item of interest ahead of the Fed’s continued trend of tightening.
Nasdaq 100 Daily Chart
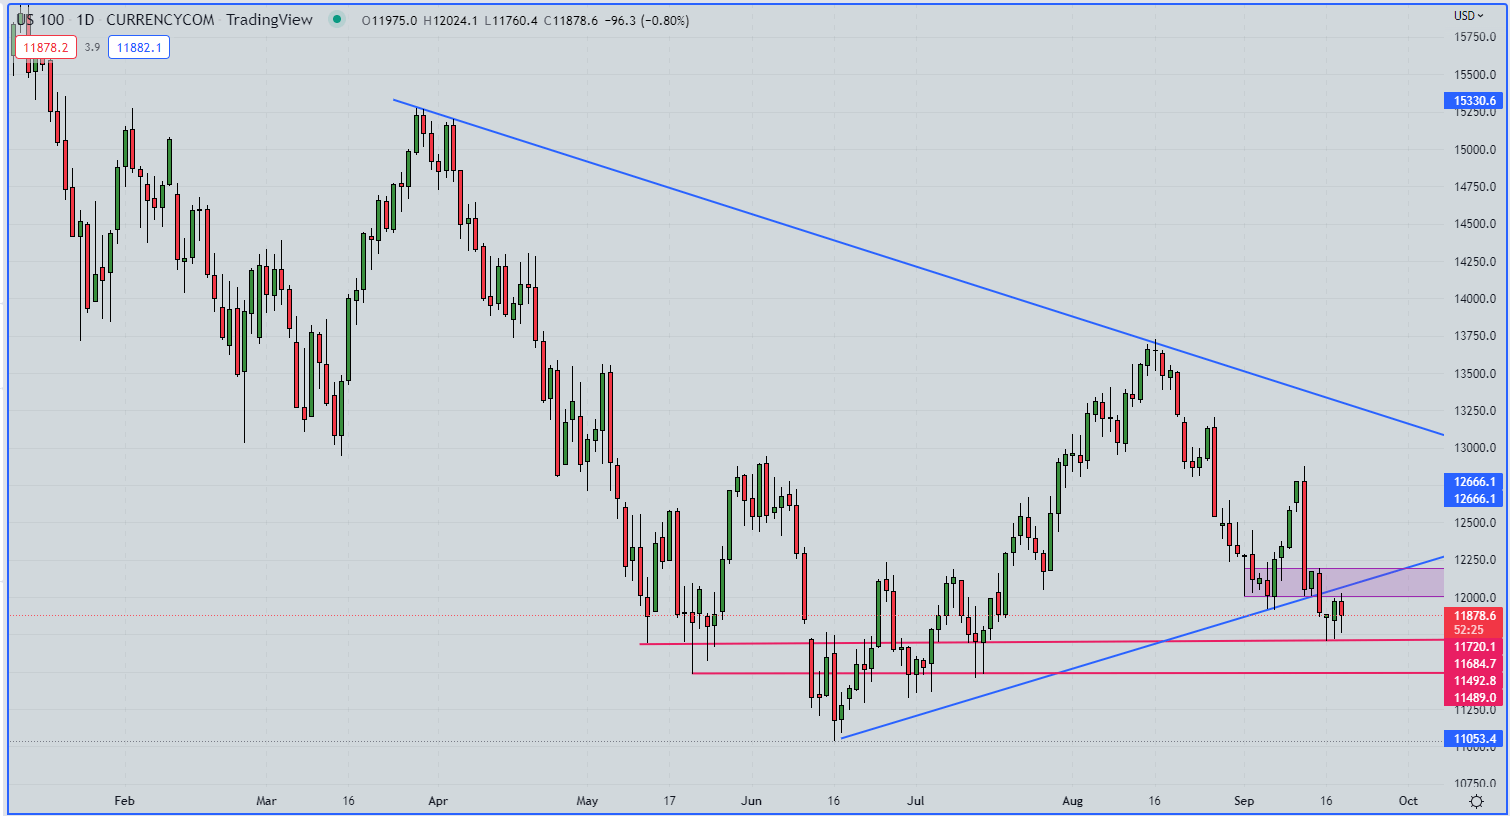
Nasdaq100 Daily Chart. Preapred Using TradingView
EDUCATION TOOLS FOR TRADERS
- Are you just getting started? Download thebeginners’ guide for FX traders
- Would you like to know more about your trading personality? Take theDailyFX quizand find out
- IG’s client positioning data provides valuable information on market sentiment.Get your free guideon how to use this powerful trading indicator here.
—Written by Cecilia Sanchez-Corona, Research Team, DailyFX
[ad_2]
Image and article originally from www.dailyfx.com. Read the original article here.