

[ad_1]
There is not a lot of upside for the S&P 500 from here, even under bullish multiple assumptions.
The date is 13 November 1929. The stock market has fallen 45% in less than two months. Are you at the bottom? You’re not sure. You wait. Two months go by and the market has rallied 25%. You’re frustrated. You’re missing out. You add risk. Another couple of months go by and stocks rally a further 17%. You’re vindicated. You add more risk. But ‘as flies to wanton boys are we to the gods; They kill us for their sport’. Your portfolio is down 83% over the next two years.
Was 16 June, market down 24%, the nadir, or a false trough?
You pick the wrong trough and you can end up dead in that ditch. While It feels unlikely that we are in an environment as extreme as the Great Depression, investors thinking about the road ahead from here are faced with a similar conundrum. Was 16 June, market down 24%, the nadir, or a false trough?
Looking at how forward earnings and the multiple travelled through prior periods of stress can give some hints toward an answer. As a shorthand we take historic US NBER recessions; Figure 1 charts these elements through the last four. For each we show the recession (red shaded area), and the 12 months either side. Blue on the blue vertical axis is the S&P price, yellow on the yellow vertical axis is forward EPS, and green on the green vertical axis is the multiple. We also show the percent move in each of these metrics in the 12 months prior to the downturn, in the recession itself, and in the 12 subsequent months.
Figure 1. S&P 500 Price, Forward Earnings and the Multiple Around and Through the Last Four Recessions
Source: Bloomberg, Man Solutions calculations. The periods selected are exceptional and the results do not reflect typical performance. The start and end dates of such events are subjective and different sources may suggest different date ranges, leading to different performance figures.
We can call DotCom a valuation story, while GFC and Covid were more fundamentally orientated sell-offs.
Eight observations:
- The peak to trough earnings revision, in chronological order, is -7%, -13%, -39%, -21%. On average -20%
- Similarly, the peak to trough multiple compression is 2, 10, 5 and 2 points. On average 5 points
- The trough multiple is 11x, 14x, 11x and 16x. On average 13x
- So broadly speaking, we can call DotCom a valuation story, while GFC and Covid were more fundamentally orientated sell-offs
5. If 16 June was the trough of the 2022 bear market, this one is a valuation tale as well. Peak to trough multiple compression through to the June low was 6 points (22x to 16x), while the downward earnings revision has, so far, been negligible
6. The multiple tends to trough prior to the earnings estimate, and on average four months before (admittedly in DotCom there was further compression following the recession trough)
7. In the prior four recessions, the multiple bounces markedly from its trough. In the six months following the nadir, in chronological order, it rises by 3, 2, 4 and 5 points. On average 3 points
8. IF EPS estimates follow their historical link with the ISM (see The Road Ahead: Here Come the Downgrades), this augurs for an integer of $190 in June 2023. That would represent a 21% peak to trough decline, in line with the Covid recession
And here’s a little thought experiment…
If earnings were to follow the pathway outlined in point (8), above, what would have to happen to the multiple to get a bull case. In Figure 2 (right hand panel) we show the projected EPS pathway (yellow dashed line, second vertical axis) and four forecasts for the S&P based on different multiple scenarios (outline in the left hand panel).
Figure 2. Some pathways for the S&P based on different multiple assumptions
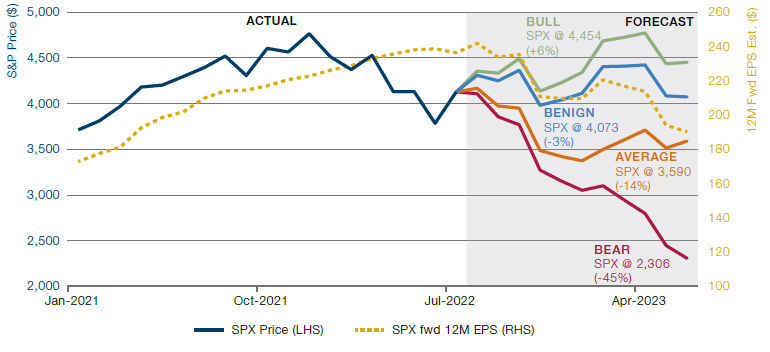
Source: Bloomberg, Man Solutions calculations; as of August 2022.
BULL CASE:
- Inflation moderates faster than expected
- Central bank pivot
- Return of secular stagnation
- Ukraine situation calms
- Multiple returns to cycle high 23x (last seen 20 August)
BENIGN:
- Inflation moderates enough
- Central bank pivot
- Ukraine situation stabilises
- Multiple returns to end 2021 level of 21x
AVERAGE OF PREVIOUS RECESSIONS:
- Recession concern persists
- Playbook of prior recessions plays out:
- On average the multiple troughs 4 months prior to the forward earnings trough. Therefore assume trough multiple this time around is February 2023
- Historic average multiple compression of 5 points. To June trough we were at -6 points. Therefore assume we revert back to June level (16x) by February 2023
- On average the multiple rises 3 points in the 6 months following the trough. Therefore assume from February to June 2023 it rises from 16x to 19x
BEAR CASE:
- Inflation is stubborn
- Recession is fully priced in
- Multiple follows worst case scenario DotCom bust compression of 10 points
- Multiple therefore drops to 12x
So – while there is a thicket of ifs, buts and nauseously worded compliance disclaimers around this – it would suggest that should earnings follow historical precedent, there is not a lot of equity upside from here, even under bullish multiple assumptions. This has been no ordinary cycle so it may well be that historical precedents are for the birds. But worth pondering.
[ad_2]
Image and article originally from www.man.com. Read the original article here.