
[ad_1]
“We saw this tug of war between goods moderating and services remaining strong. This is not a tug of war. They both moved up. .. Right now I think the Fed is going to be looking at this with a lot of concern. This is no good news across this report.” – Nomura
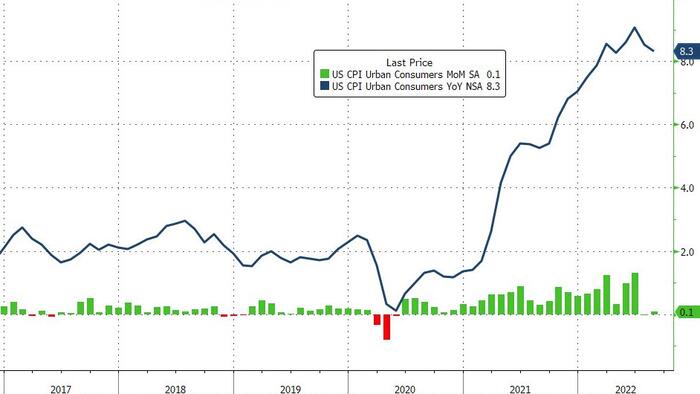
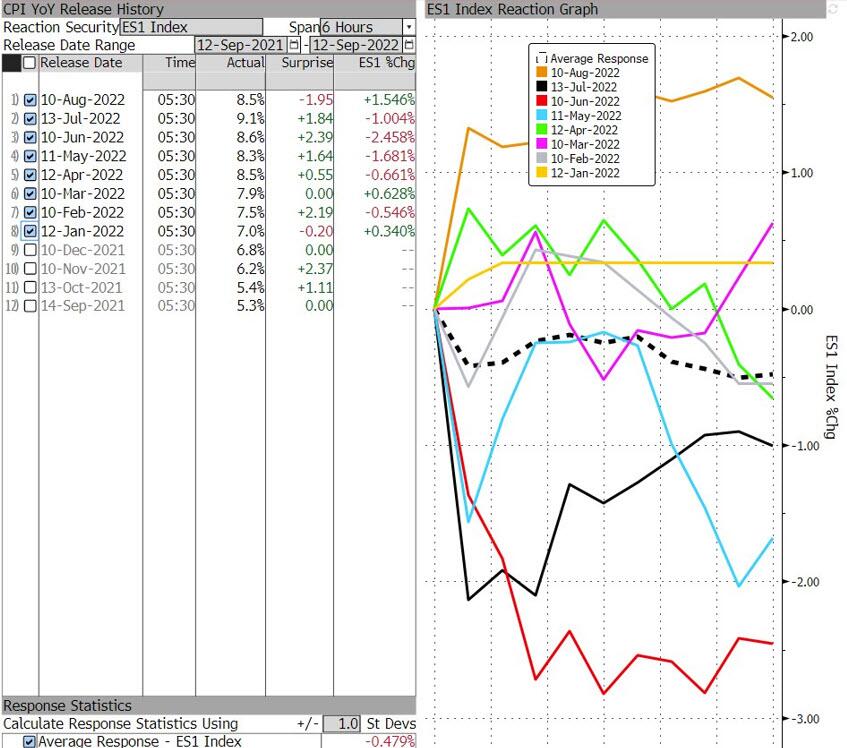
Expectations for a 0.1% MoM drop in CPI has set the squeeze-algos on fire in recent days as the small drop signals ‘peak inflation’ and goldilocks and a unicorn-filled Fed will step back and declare victory (with a lag). Short-term interest-rates – however – have not been buying that dovish story, so how the market reacts to today’s print will be fascinating given the technical background of extreme negative delta and positioning, and now momentum. The market was pricing in a 90% chance of a 75bps hike by The Fed next week ahead of the CPI print.
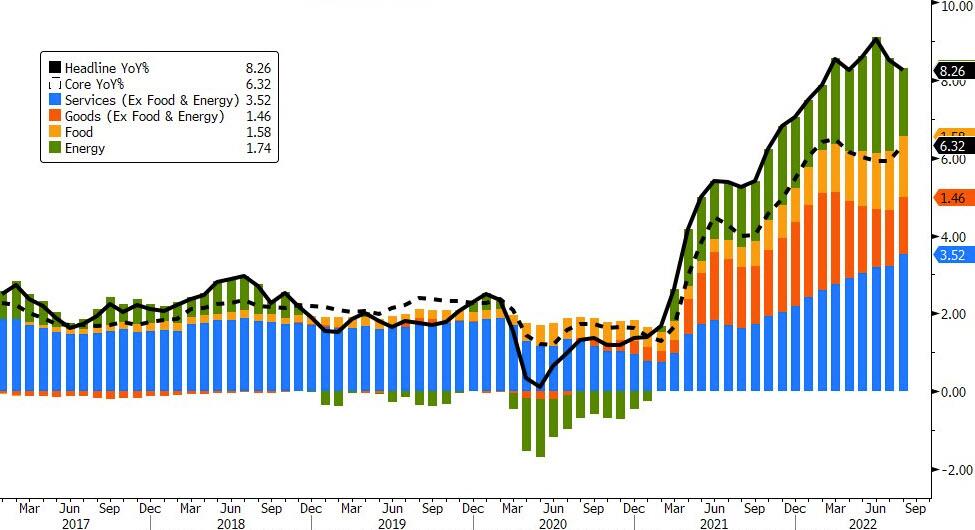
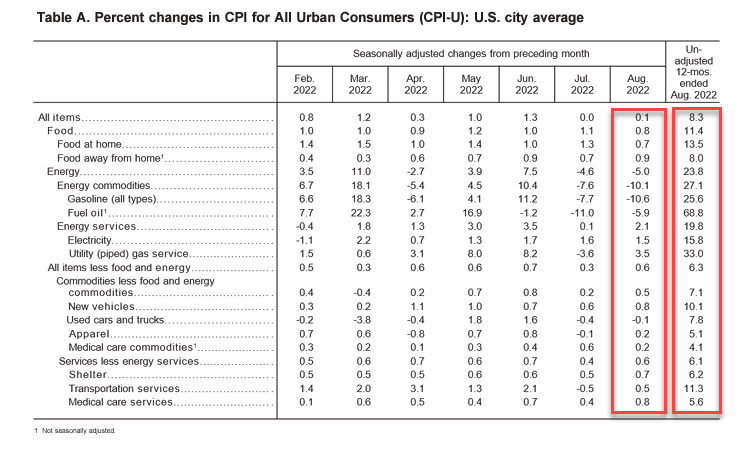
Headline CPI came hotter than expected rising 0.1% MoM vs expectations of -0.1% MoM. That is the 27th straight month of rising inflation. And while the ascent in energy fizzled, with the energy index increasing 23.8% for the 12 months ending August, a smaller increase than the 32.9% increase for the period ending July, the big shock was the food index which increased 11.4% over the last year, the largest 12-month increase since the period ending May 1979, while the food at home index rose 13.5% the largest 12-month increase since the period ending March 1979.
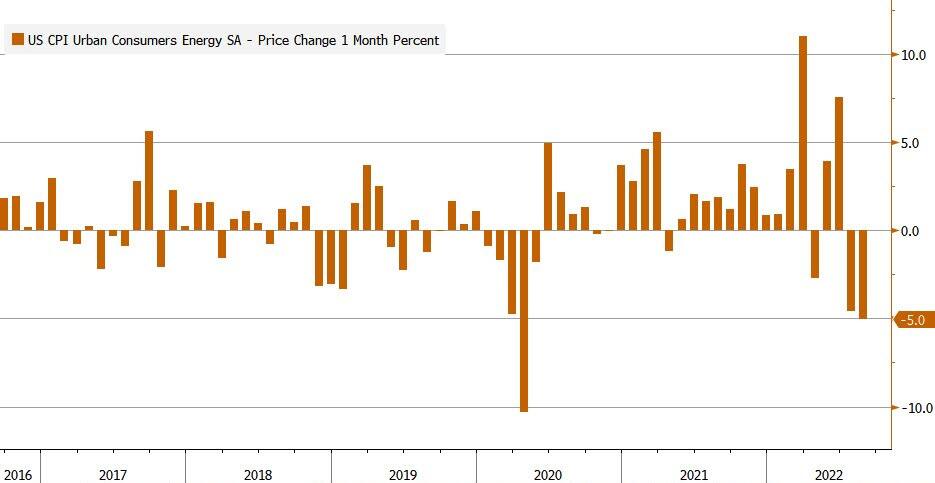
The flip side: the energy component of August CPI fell by 5% M/M: the biggest drop since the covid crash in April 2020.
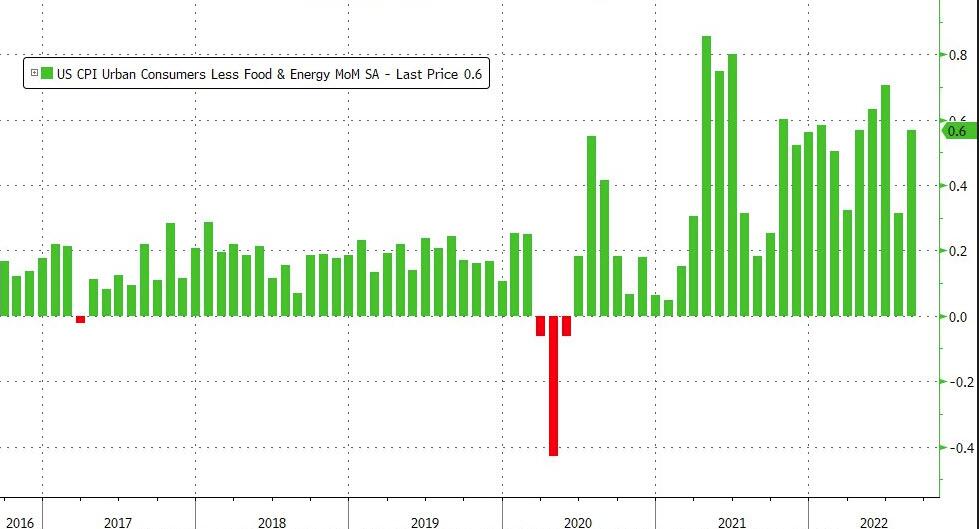
More notably, the Fed’s preferred metric – Core CPI – was dramatically hotter than expected rising 0.6% MoM (double the +0.3% expected)
Source: Bloomberg
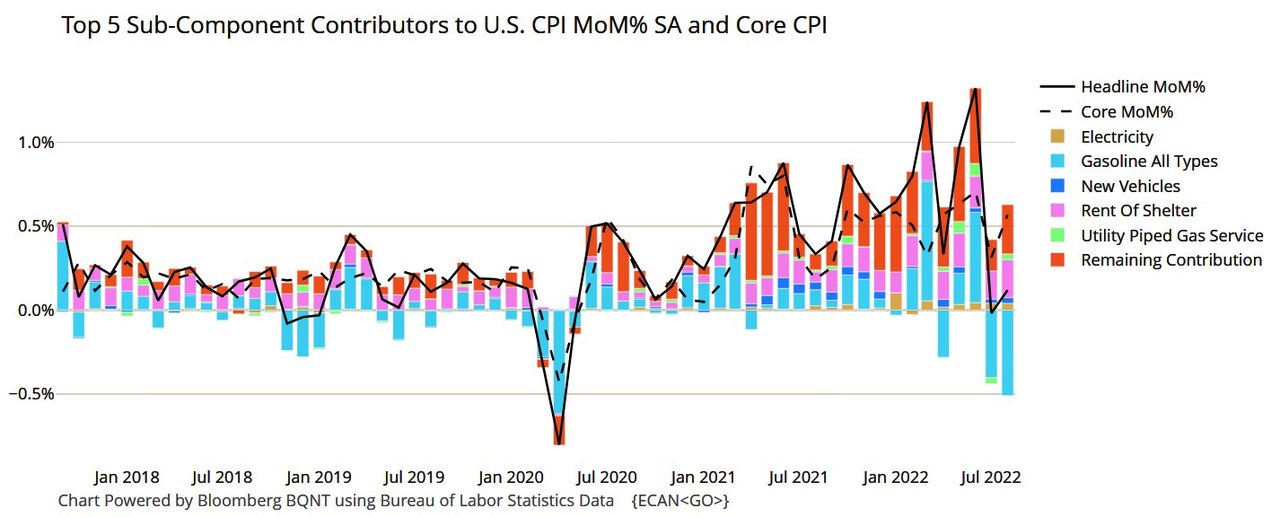
On a MoM basis both headline and core rose driven by Core Services (while energy slid)…
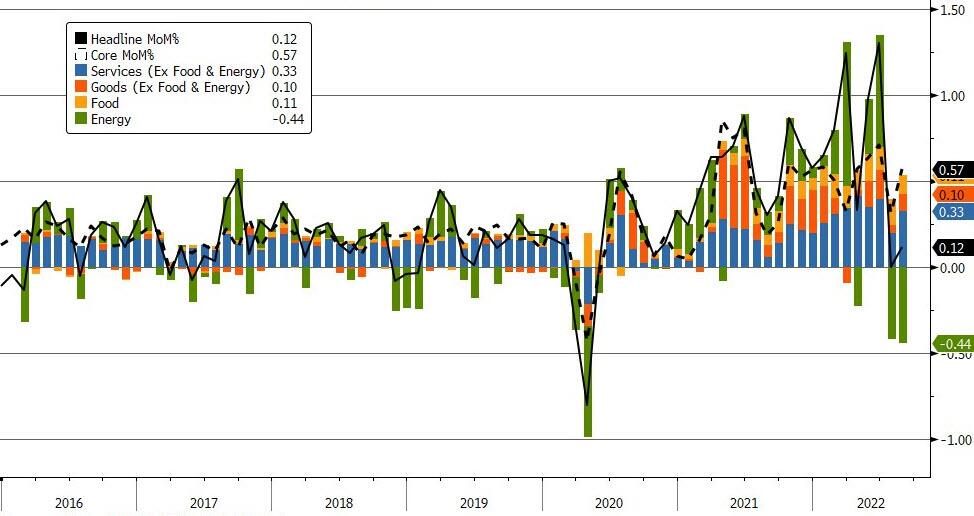
On a YoY basis, core CPI rose while headline slowed modestly but Core Services was the biggest driver…
Under the hood, energy costs fell while food prices and shelter costs rose..
Visually, Shelter costs dominated the MoM rise…
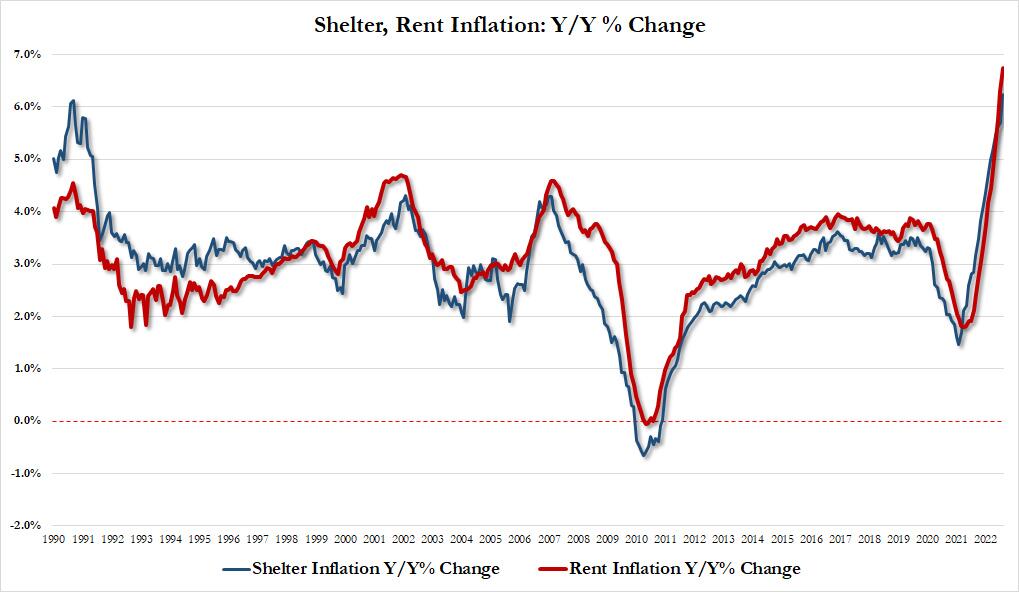
… while on a Y/Y basis, shelter has become the dominant driver…
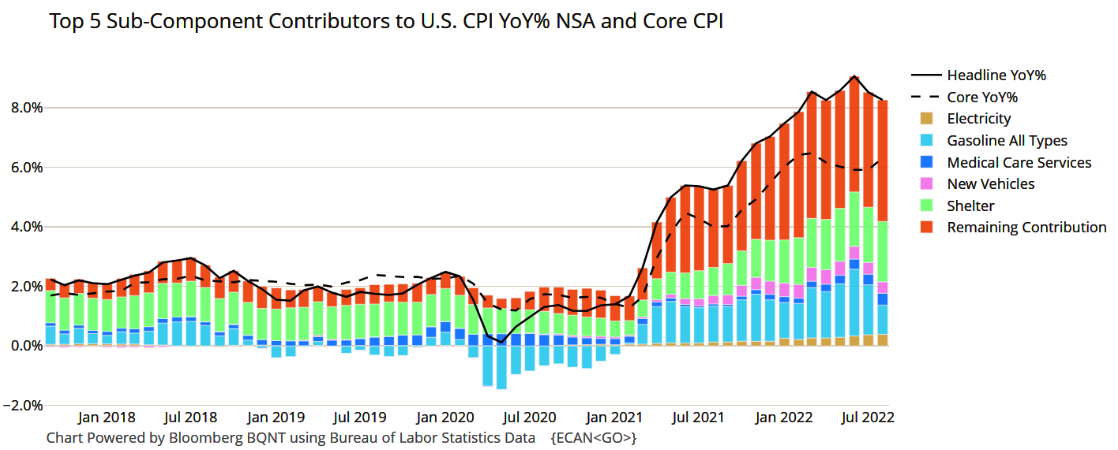
… and indeed, looking at just shelter and rent, we find the former rising 6.24%, a big jump from July’s 5.69% and surpassing the previous high from August 1990 of 6.1%. Rent inflation, meanwhile, hit higher highs, rising to 6.74%, a print which only can be found going all the way back to the early 1980s!
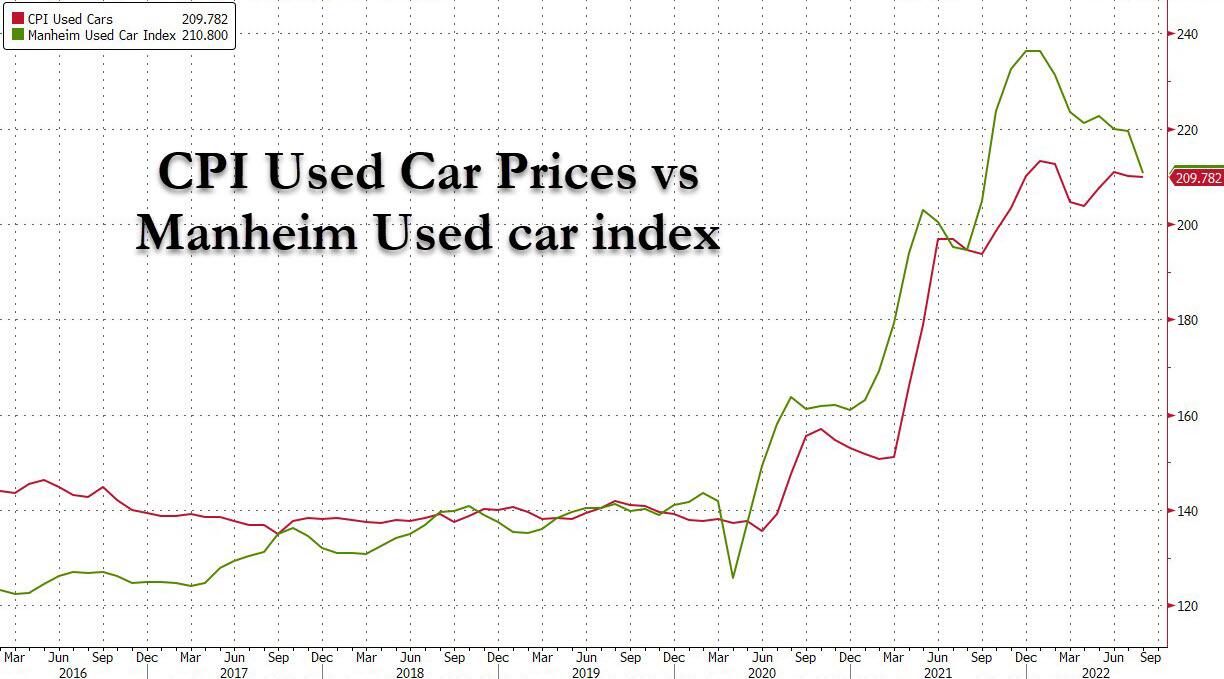
Unexpectedly, while used car prices extended their recent drop…
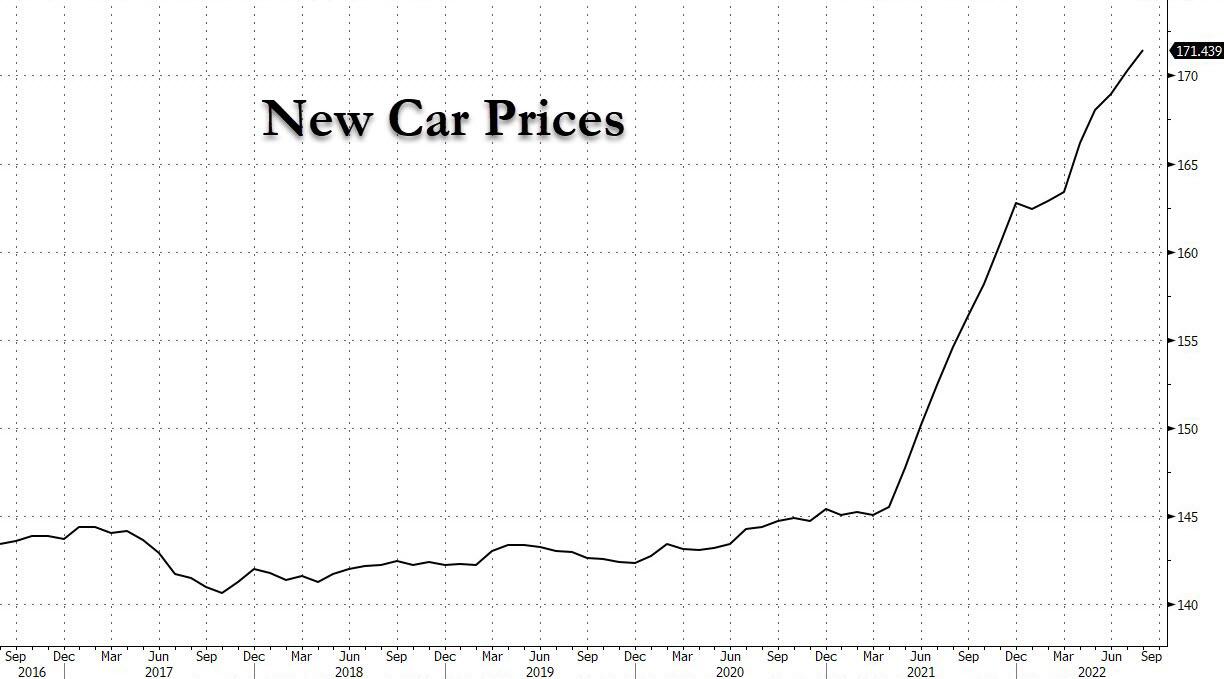
… new car prices continued to rise:
Oh, and if you want your Obamacare hyperinflation, you can keep your Obamacare hyperinflation: Health insurance is now up 24.3% for the year, rising 2.4% over the past month.

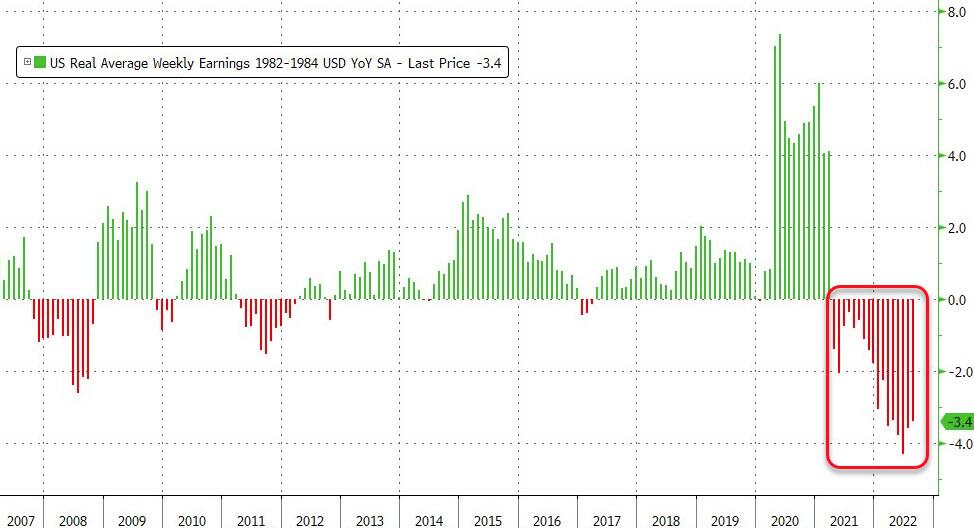
Finally, we note that for the 17th straight month, Americans’ wages lost ground relative to the cost of living.
Source: Bloomberg
Finally, as a reminder, the S&P 500 has lost on average 0.5% on CPI day…
Trade accordingly.
[ad_2]
Image and article originally from www.zerohedge.com. Read the original article here.