After continuing to rise in an unabated manner for three sessions out of four in the truncated week, the Indian equity markets managed to end the week on a positive note, but also witnessed a sharp profit-taking bout in the last trading session. The markets began the week a bit late from Tuesday, as Monday was a trading holiday on account of Independence Day. Given the short week, India had just four trading sessions against five; for the first three out of them, the NIFTY continued inching higher. The trading range remained narrow; the index oscillated in the 281.45 point range, before ending the week with a net weekly gain of just 60.30 points (+0.34%) on a weekly basis.
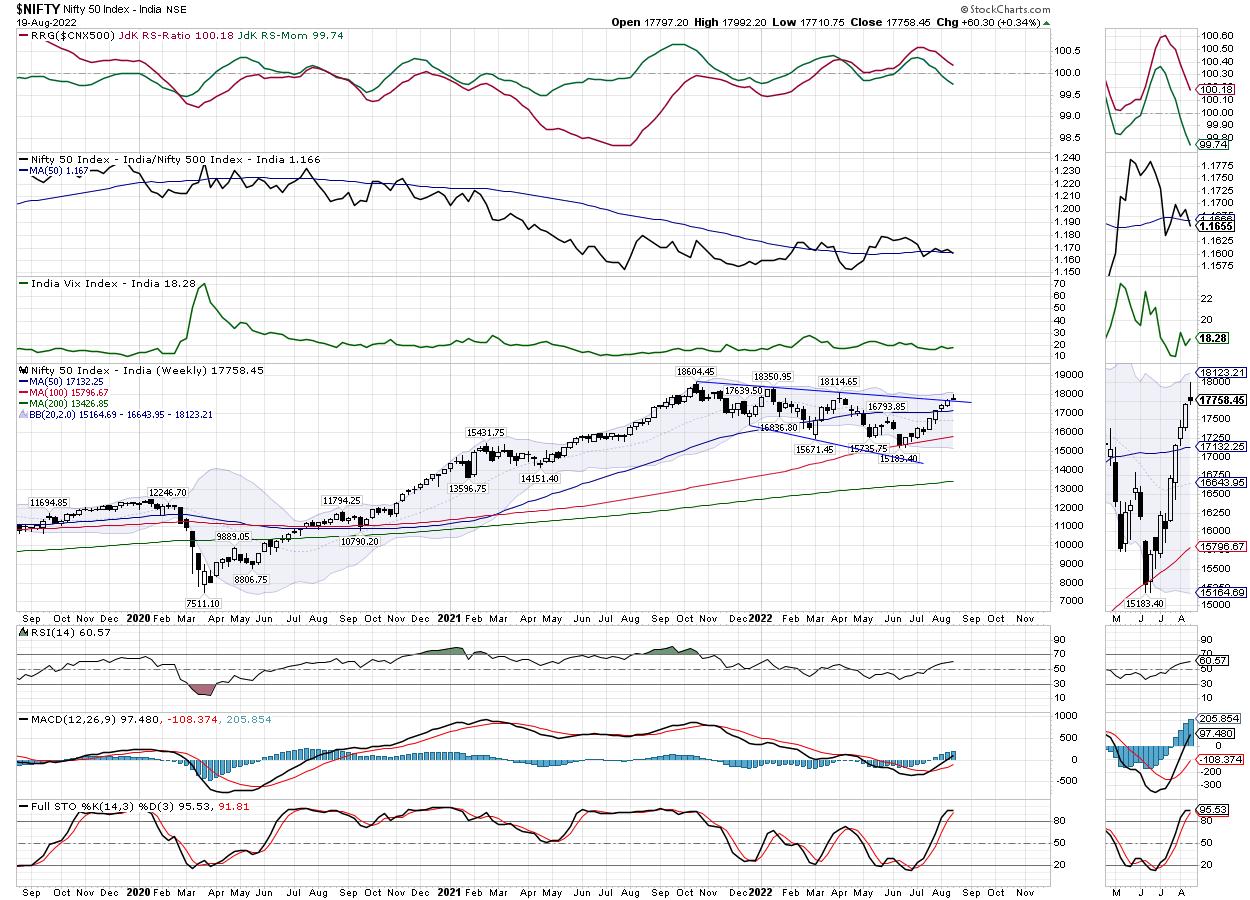
From a technical perspective, the most important of the four previous sessions was that on Friday. Both NIFTY and NIFTY Bank Index were steeply overbought on the daily time frame; apart from this, they also appeared structurally over-extended on the charts. The previous session has resulted in the formation of a large bearish engulfing candle; this may prove itself to be even more significant and potent, as it has emerged following a steep uptrend. Besides this, the options data also indicate that, looking at the Open Interest across strike prices, NIFTY and Nifty Bank may find strong resistance at 18000 and 39500 levels respectively. Volatility rose; INDIAVIX climbed higher by 3.85% to 18.28 on a weekly note.
The coming week, which will also see the expiry of the current month’s derivative series, is likely to start on a quiet note. NIFTY will face strong resistance at the 17950 and 18050 levels. Supports are expected to come in at 17650 and 17500 levels. The trading range is likely to get wider than usual over the coming week.
The weekly RSI is 60.57; it has marked a new 14-period high, but does not show any divergence against the price. The weekly MACD is bullish and trades above the signal line.
A Shooting Star occurred on candles. For a valid shooting star to occur, there must be a higher opening (the open to be higher than the high point of the previous candle), it must inch higher, and the close must be significantly lower than the candle’s high. The one that has occurred is a valid shooting star. This has the potential to stall the present rally; however, a confirmation will come if the NIFTY slips below the low point of the previous week.
The coming week will see markets behaving in a very tentative manner; in all likelihood, the NIFTY has formed a potential halt of the rally at the high point of the previous week, i.e., 17992. This translates into the levels of 18000 acting as a very strong resistance point for the markets going forward. It is strongly recommended that all up moves from now be utilized to book and protect profits at higher levels. Fresh purchases should be done less aggressively; they should be kept limited only to those pockets of stocks that are showing improvement in their relative strength against the broader markets. A highly cautious approach is advised for the coming week.
Sector Analysis for the Coming Week
In our look at Relative Rotation Graphs®, we compared various sectors against CNX500 (NIFTY 500 Index), which represents over 95% of the free float market cap of all the stocks listed.
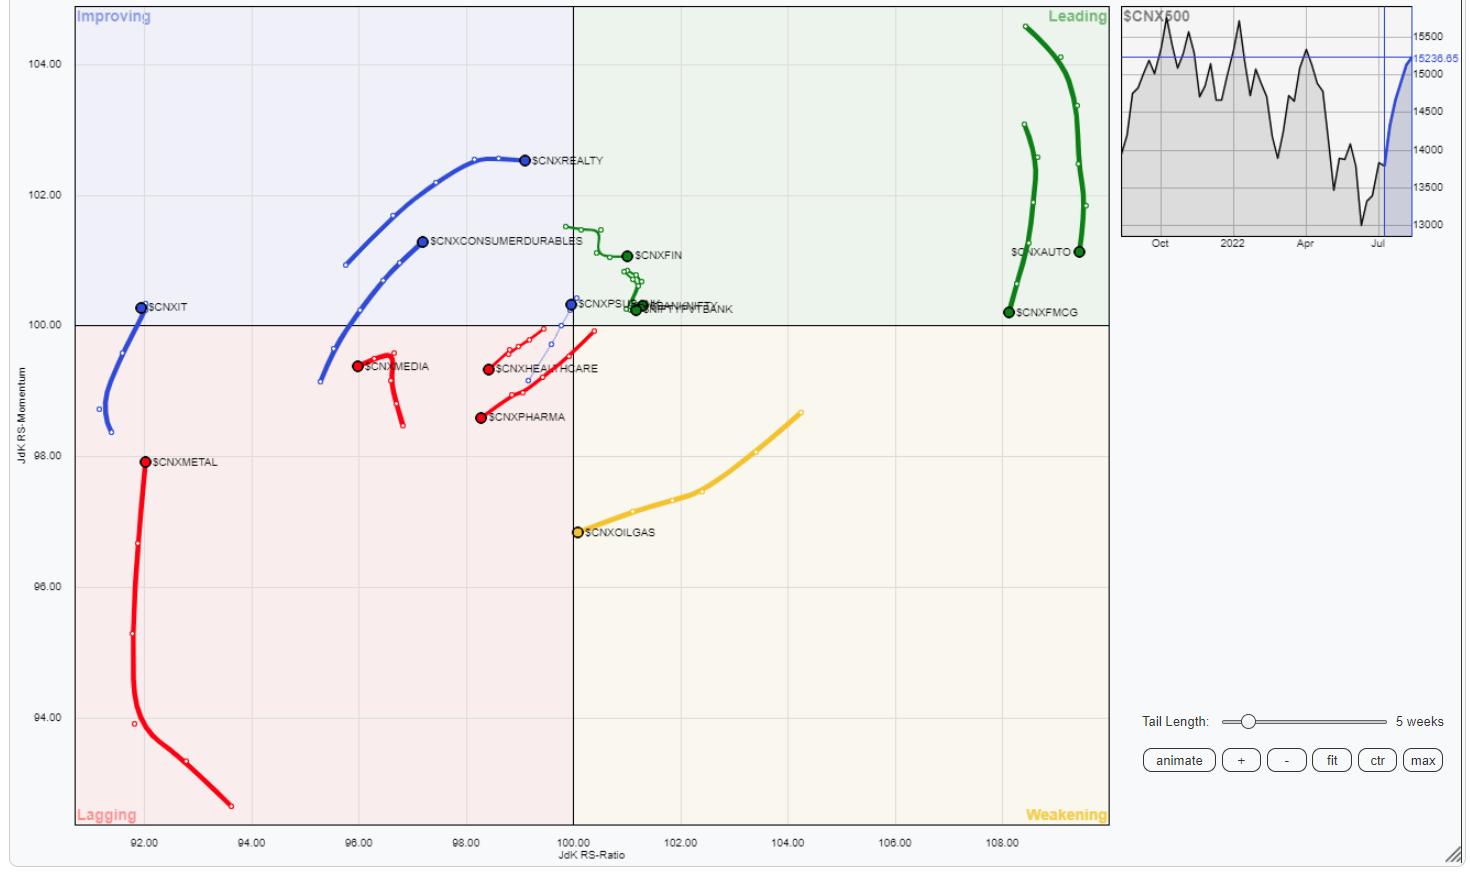
The analysis of Relative Rotation Graphs (RRG) shows that, just like the previous week, BankNifty, Nifty Consumption, FMCG, Auto, and Financial Services indexes are continuing to pare their relative momentum against the broader markets. Further, while NIFTY MidCap 100 index stays well inside the leading quadrant, the PSU Bank has rolled back inside the improving quadrant.
NIFTY Energy remains in the weakening quadrant for this week as well; it appears to be about to roll inside the lagging quadrant.
NIFTY Infrastructure and NIFTY PSE Indexes have rolled inside the lagging quadrant and may see relative underperformance against the broader markets. Besides this, NIFTY Pharma and Media also continue to languish inside the lagging quadrant. NIFTY Commodities and Metal Index are inside the lagging quadrant, but they continue to improve on their relative momentum.
NIFTY IT stays in the improving quadrant along with the Realty Index. These may continue to perform well over the coming week.
Important Note: RRG™ charts show the relative strength and momentum for a group of stocks. In the above Chart, they show relative performance against NIFTY500 Index (Broader Markets) and should not be used directly as buy or sell signals.
Milan Vaishnav, CMT, MSTA
Consulting Technical Analyst