
[ad_1]
- Dollar Index retreats of 20-year highs, leads XAUUSD higher.
- US CPI report due Tuesday is the final one before the FED meeting. Will it cap gains or boost the precious metal further?
Starts in:
Live now:
Sep 13
( 02:09 GMT )
Recommended by Zain Vawda
Weekly Commodities Trading Prep
XAUUSD Fundamental Backdrop
Gold extended its upside rally from last week’s lows, a move which was largely driven by dollar weakness. We have seen that continue as the day began with market sentiment improving as investors eye the possibility that US inflation has peaked. In a further positive for market sentiment, we saw news filter through regarding Ukraine recapturing some cities previously under Russian control in what seem analysts believe could be a turning point for the war.
DXY Daily Chart – September 12, 2022
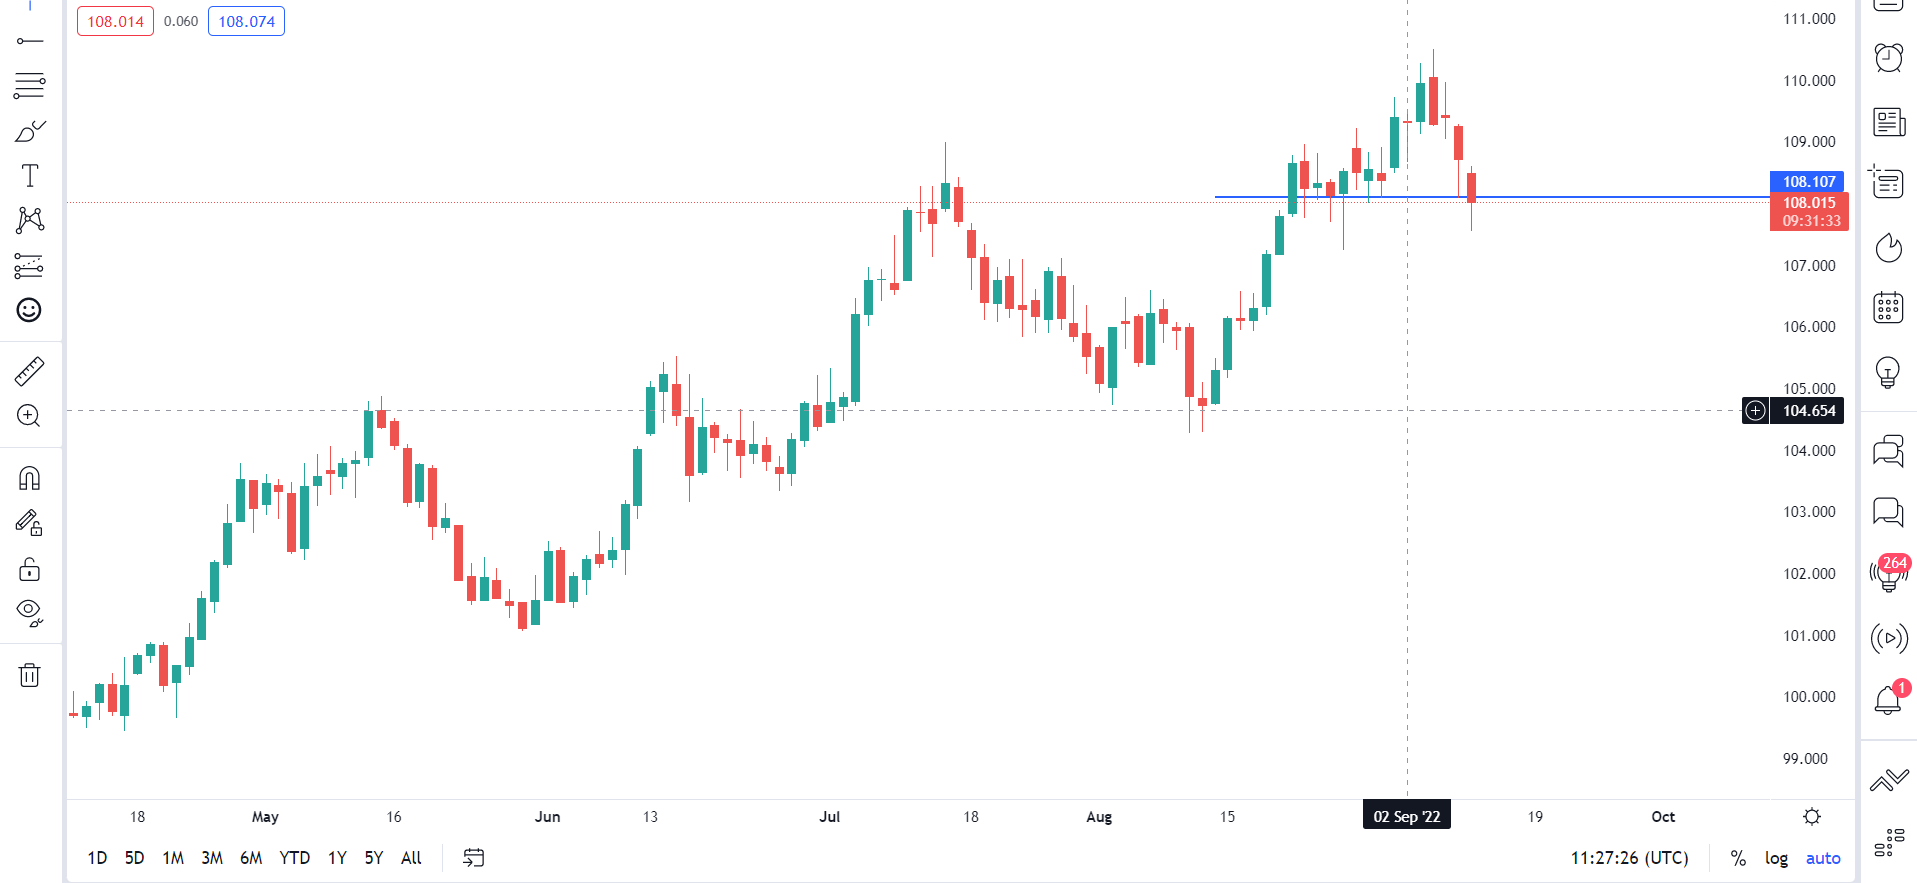
Source: TradingView
US CPI data due tomorrow remains the data event of the week which could serve to cap any upside gains on the precious metal. A positive US CPI print will do little to change the mood of investors with the majority pricing in another 75bp hike. A downside surprise on US CPI could see some dollar weakness, however according to the rhetoric of Fed Members its going to take more than one print to convince them of plateauing or declining inflation. Federal Reserve Member James Bullard had the following to say ““I wouldn’t let one data point sort of dictate what we are going to do at this meeting. So I am leaning more strongly toward 75 at this point.” Judging by this guidance it seems evident that the Fed will show no knee jerk reaction should the inflation print surprise to the downside.
For all market-moving economic releases and events, see the DailyFX Calendar
Foundational Trading Knowledge
Commodities Trading
Recommended by Zain Vawda
XAUUSD Daily Chart –September 12, 2022
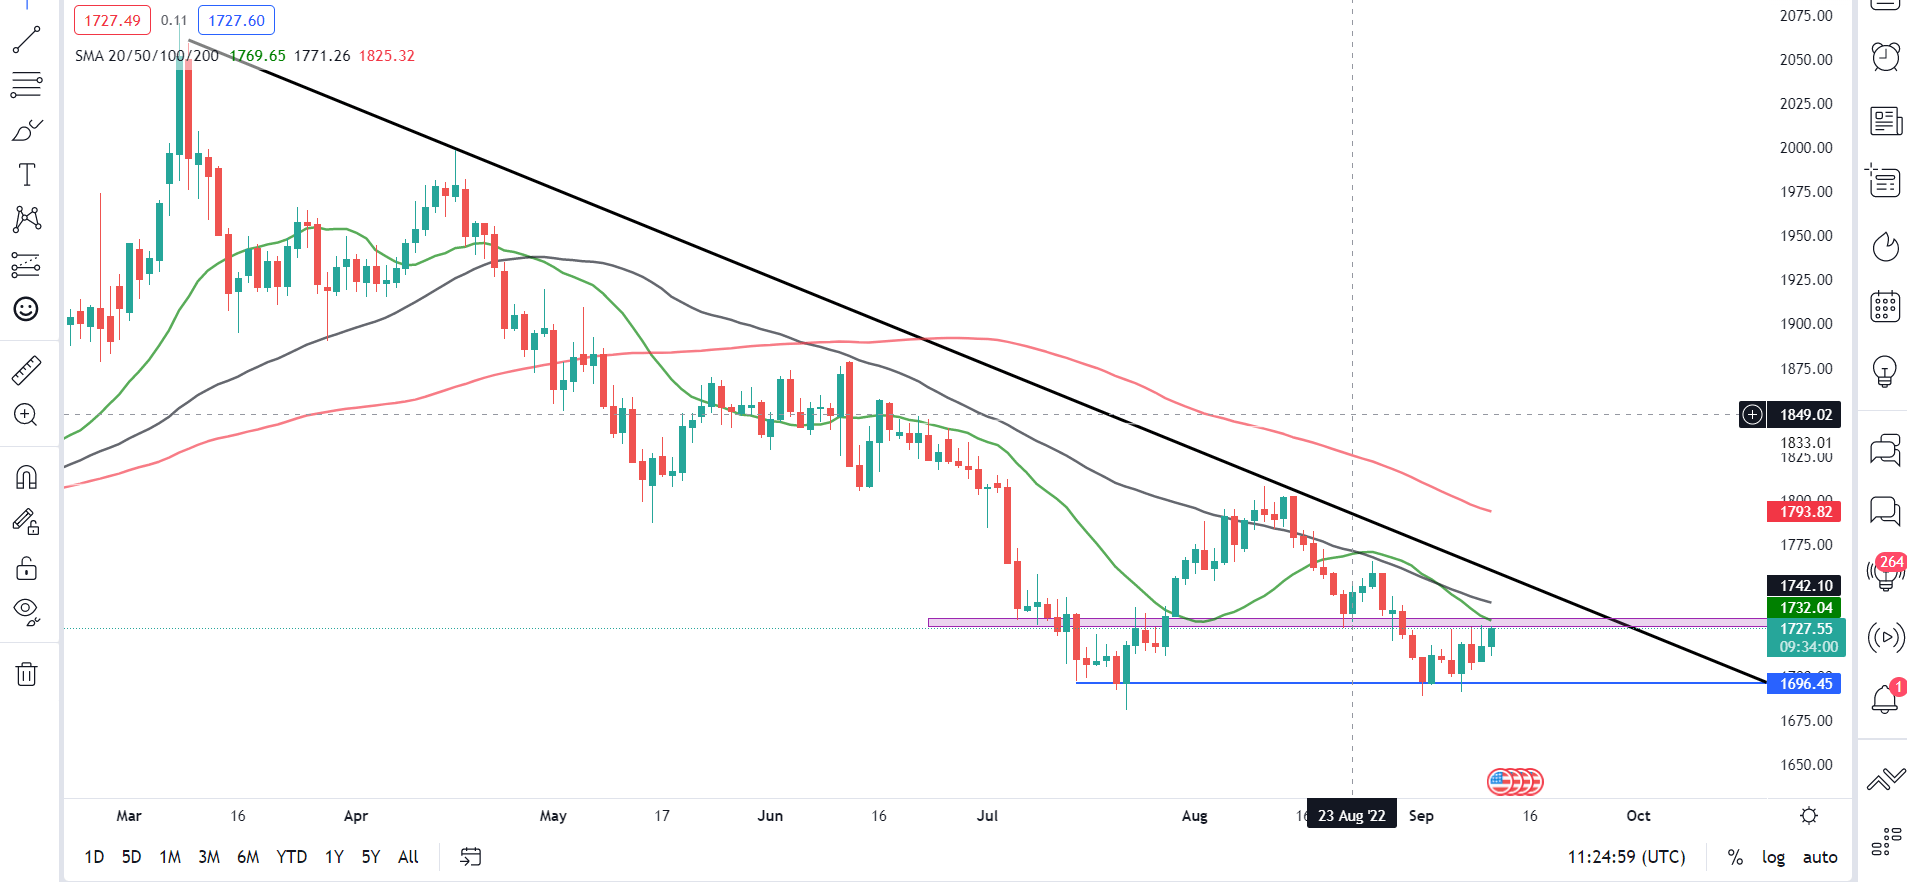
Source: TradingView
From a technical perspective, we had a bullish inside bar candle close on the weekly indicating the potential for further upside this week. We also created a double bottom before bouncing last week from around the $1688 area. On the daily timeframe we havehad a nice bounce this morning from around $1712 as we approach resistance at the $1730 area. We currently trade below the 20,50 and 100-SMA with the gradients pointing to the downside which doesn’t bode well for the precious metal. A break and candle close above the $1730 area will still see us have the 20 and 50-SMA providing significant resistance. Price action indicates higher prices may be in store as we create higher highs and higher lows on the 4H and 1H yet the bigger picture ahead screams caution as gains could be capped in anticipation of the US CPI release. Keeping this in mind there is a real chance we see the precious metal rangebound between $1712 and the $1730 heading into tomorrow’s CPI print.
Introduction to Technical Analysis
Technical Analysis Chart Patterns
Recommended by Zain Vawda
Key intraday levels that are worth watching:
Support Areas
•1720
•1712
•1700
Resistance Areas
•1731
•1741
•1750
| Change in | Longs | Shorts | OI |
| Daily | 0% | 34% | 3% |
| Weekly | 16% | 0% | 13% |
Resources For Traders
Whether you are a new or experienced trader, we have several resources available to help you; indicator for tracking trader sentiment, quarterly trading forecasts, analytical and educational webinars held daily, trading guides to help you improve trading performance, and one specifically for those who are new to forex.
Written by: Zain Vawda, Markets Writer for DailyFX.com
Contact and follow Zain on Twitter: @zvawda
[ad_2]
Image and article originally from www.dailyfx.com. Read the original article here.