The top gainer in the S&P 500 index on Friday was Citigroup (C), up over 13% on a strong earnings report. So the chart is obviously bullish, right?
Not so fast.
It is very easy to get drawn into short-term signals like one-day price movements. But the trick is to make short-term decisions using short-term data and long-term decisions using long-term data. So, while C popped 13% higher on Friday, the stock is still down about 16% for the year!
Other names in the Financial sector rallied strongly on Friday as well, including Wells Fargo (WFC), State Street (STT), Bank of America (BAC) and Bank of NY Mellon (BK). All of the above stocks were in the top ten performers of the S&P 500 index on Friday. But when we take a step back and reflect on the performance of Financials in 2022, it’s difficult to see the chart as anything but bearish.
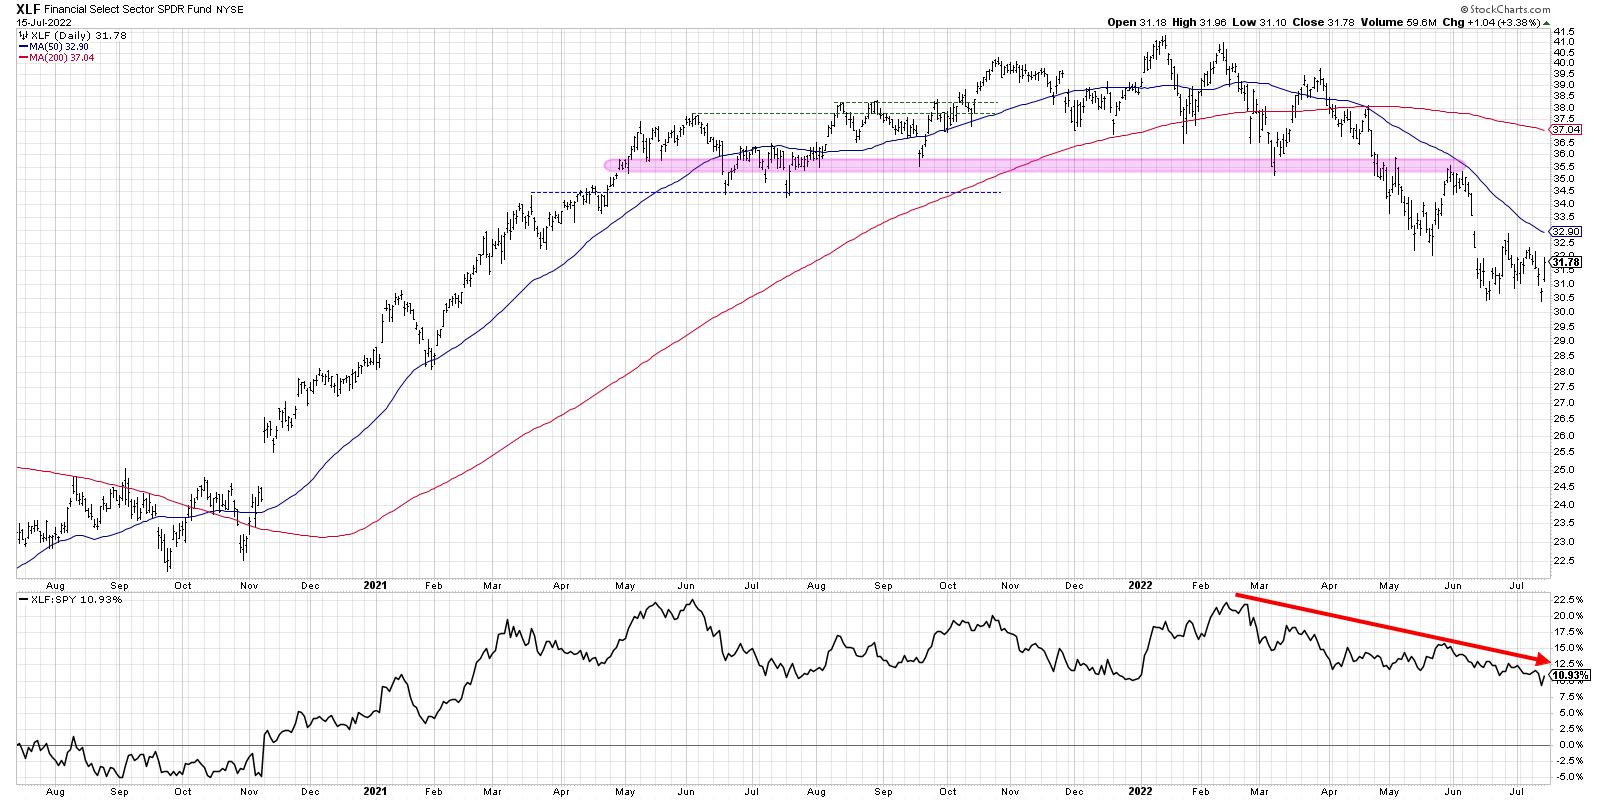
The XLF provides a brilliantly clear illustration of a chart rotating from accumulation phase (March 2020 to mid-2021) to topping phase (mid-2021 to early 2022) to a distribution phase (basically the last six months). I label something in a “distribution phase” if we see a fairly consistent pattern of lower highs and lower lows. And the XLF certainly fits the bill starting in March 2022.
Each attempt to bounce higher of a new low as stalled out before overcoming the most recent swing high. Sellers are dominating, and not enough buyers are materializing to push the price above any key resistance levels. Most negatively, the relative strength has been in a consistent downtrend since February. So not only has this sector been in a downtrend, it’s even underperforming the S&P 500 as well.
Let’s take one of the biggest gainers this week and break down the short-term and long-term prospects.
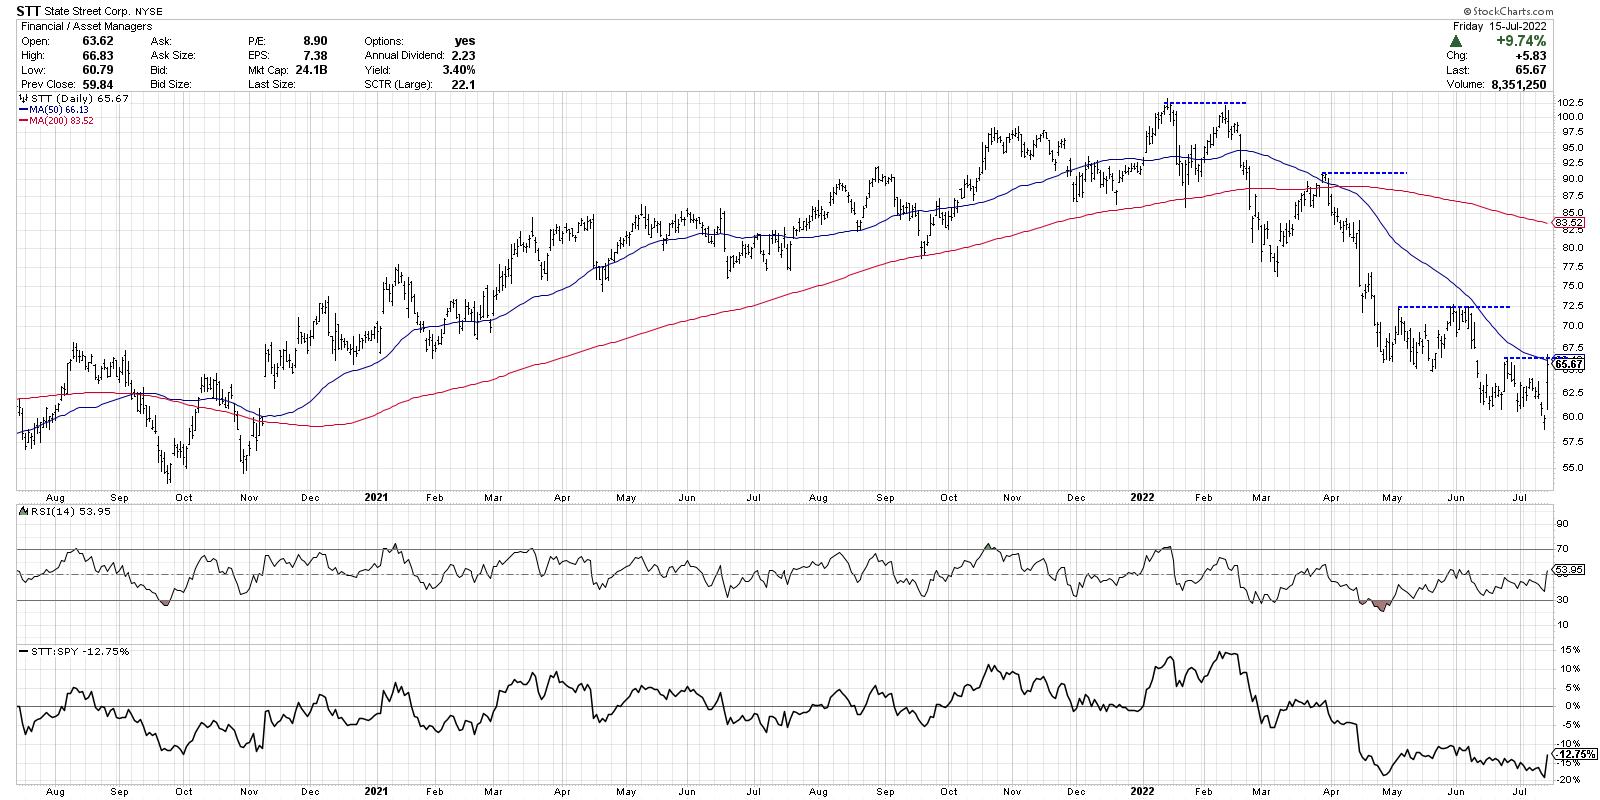
To get a sense of the long-term picture, just look at the price and the 200-day moving average. The first two-thirds of this chart show a rising price above an ascending 200-day moving average. Then, in early 2022, we see the entire trend change as the price breaks the 200-day, retests that level from below and then begins making further new lows through this week.
That’s right. Before Friday’s impressive 9.7% bounce, STT had just made a new 12-month price low.
On a short-term basis, State Street’s Friday bounce pushed the price right up to the 50-day moving average. This level (around $66) lines up well with the most recent swing high in late June. So, while the stock did indeed rally off the lows to finish the week, the up move wasn’t enough to push above clear levels of price resistance.
Bullish charts make new highs. Bullish charts stop making new lows. Bullish charts don’t just test resistance, they achieve valid breakouts above resistance and follow through to the upside. Could the lows be in for these Financial stocks? Perhaps. But I’ve not seen enough evidence on the daily charts to convince me of the upside potential in these names.
When in doubt, follow the charts!
RR#6,
Dave
P.S. Ready to upgrade your investment process? Check out my YouTube channel!
David Keller, CMT
Chief Market Strategist
StockCharts.com
Disclaimer: This blog is for educational purposes only and should not be construed as financial advice. The ideas and strategies should never be used without first assessing your own personal and financial situation, or without consulting a financial professional.
The author does not have a position in mentioned securities at the time of publication. Any opinions expressed herein are solely those of the author, and do not in any way represent the views or opinions of any other person or entity.