

[ad_1]
Gold Price Talking Points
The recent recovery in the price of gold appears to be stalling as it trades in a narrow range, and the precious metal may continue to track the negative slope in the 50-Day SMA ($1786) if it fails to clear the opening range for August.
Gold Price to Track 50-Day SMA on Failure to Clear August Opening Range
Unlike the price action in June, gold attempts to push above the moving average as it retraces the decline following the US Non-Farm Payrolls (NFP) report, and the precious metal may work its way towards the July high ($1814) takes out the monthly high ($1795).
However, the update to the US Consumer Price Index (CPI) may curb the recent advance in the price of gold even though the headline reading is expected to narrow in July as the core rate of inflation is anticipated to increase to 6.1% from 5.9% per annum in June.
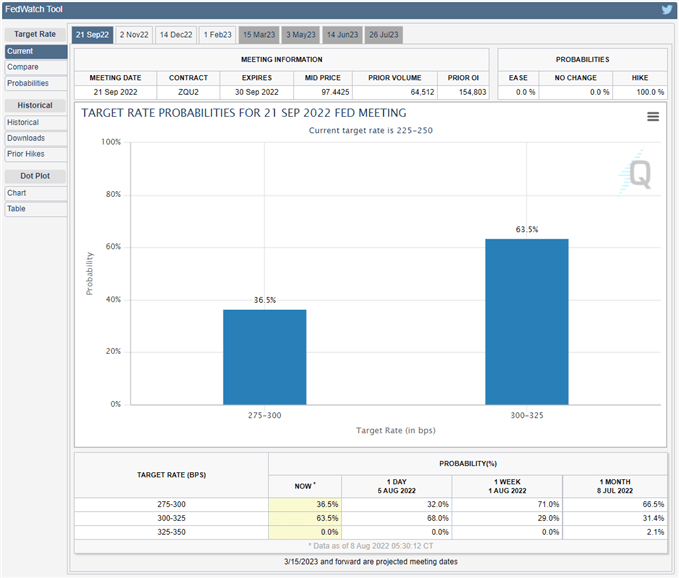
Source: CME
Evidence of sticky inflation may fuel speculation for another 75bp Federal Reserve rate hike as the CME FedWatch Tool now reflects a greater than 60% probability of seeing the benchmark interest rate climb to 3.00% to 3.25% in September.
In turn, expectations for higher US interest rates may curb gold prices with the Federal Open Market Committee (FOMC) on track to carry out a restrictive policy, and the precious metal may face headwinds throughout the remainder of the year as Chairman Jerome Powell and Co. struggle to reduce inflation.
With that said, the update to the US CPI may undermine the recent advance in the price of gold as the report is anticipated to show sticky inflation, and bullion may continue to track the negative slope in the 50-Day SMA ($1786) as it struggles to hold above the moving average.
Gold Price Daily Chart
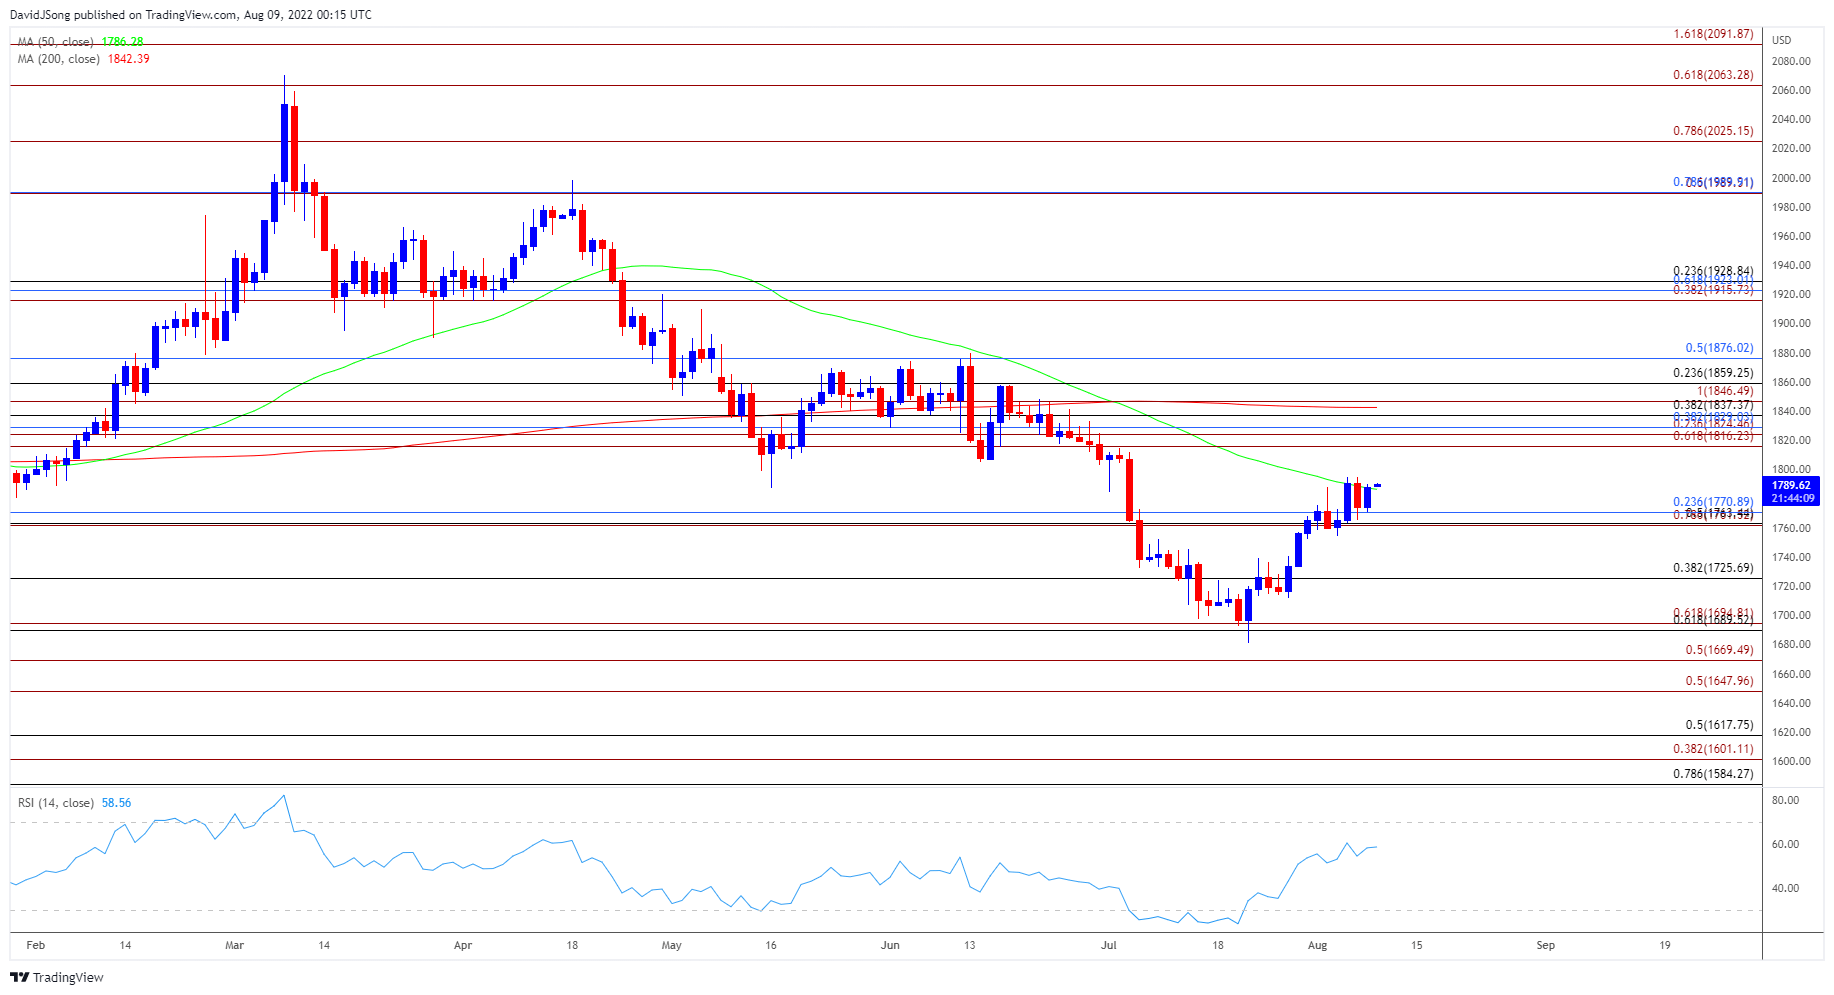
Source: Trading View
- The price of gold tests the 50-Day SMA ($1786) for the first time since April as it extends the advance from the yearly low ($1681), with a topside break of the monthly opening range raising the scope for a move towards the July high ($1814).
- A break/close above the $1816 (61.8% expansion) region brings the $1825 (23.6% expansion) to $1829 (38.2% retracement) region on the radar, but the price of gold may continue to track the negative slope in the moving average if it fails to clear the monthly high ($1795).
- In turn, failure to hold above the moving average may push the price of gold back towards the Fibonacci overlap around $1761 (78.6% expansion) to $1771 (23.6% retracement) bringing $1725 (38.2% retracement), with a break below the monthly low ($1754) bringing the $1725 (38.2% retracement) area back on the radar.
— Written by David Song, Currency Strategist
Follow me on Twitter at @DavidJSong
[ad_2]
Image and article originally from www.dailyfx.com. Read the original article here.