
[ad_1]
Recessionary fears may be top of mind these days, but for investors with a contrarian view or the confidence to remain invested amid the volatility, there are attractive opportunities in U.S. small caps.
The prospect of a Fed-induced recession to combat historical inflation has priced in valuation discounts so steep they’re difficult to ignore. If history is any indication, the future for small caps may be brighter than the grim near-term forecasts suggest.
Bargain Hunting
U.S. small caps are notoriously a “junky” market, with a prevalence of unprofitable companies that has historically ranged around 20% for the Russell 2000. But even when unprofitable companies are removed from the Index, the P/E and forward P/E ratios of the small-cap market are historically discounted.
Both measures are currently trading below long-term averages and breached a level two standard deviations below that average after May’s severe volatility.
Historical P/E (ex. Negative Earners) of Russell 2000
Historical Forward P/E (ex. Negative Earners) of Russell 2000
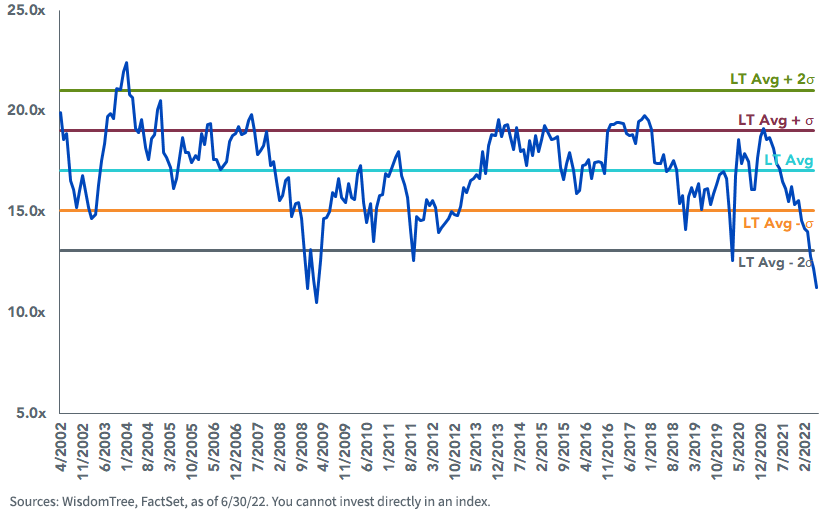
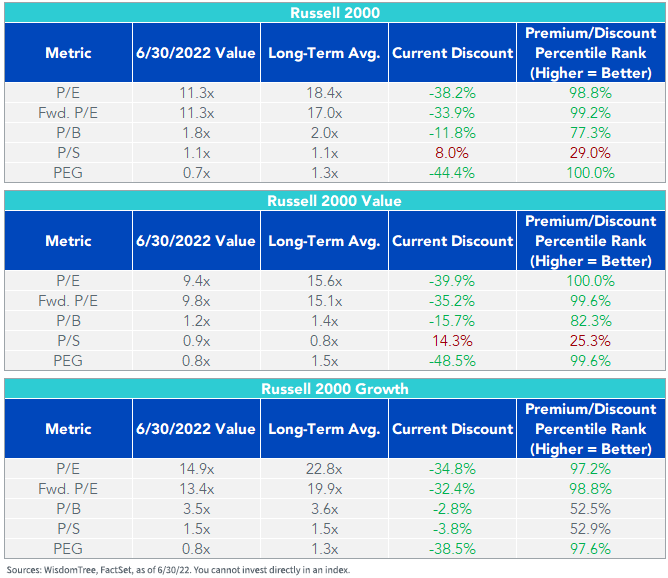
In percentage terms, both multiples are about 30% discounted from their long-term average and range between 12x and 13x.
Value and growth styles haven’t fared much better, trading about 25%–30% (and about two standard deviations) below their long-term averages.
For definitions of terms in the chart above, please visit the glossary.
Recessionary Fears Causing Undue Pain
Although most major equity indexes are near bear market territory, small caps have suffered a bit more than their counterparts along the size spectrum, owing to prevailing recession fears and threats to earnings and margins.
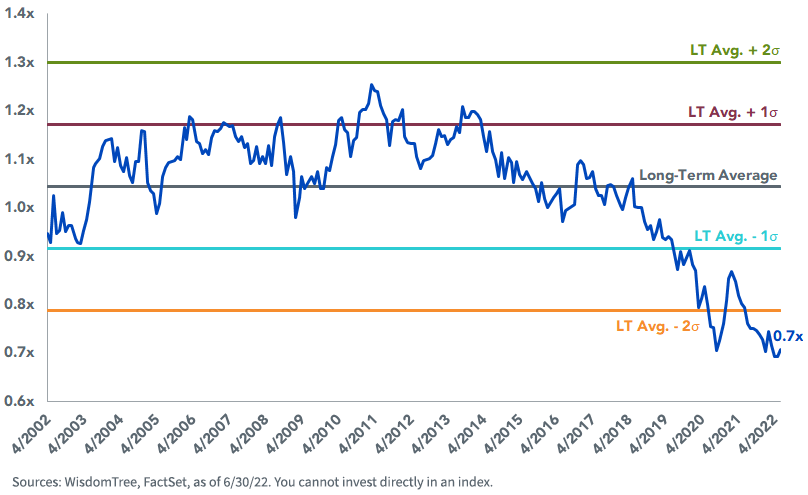
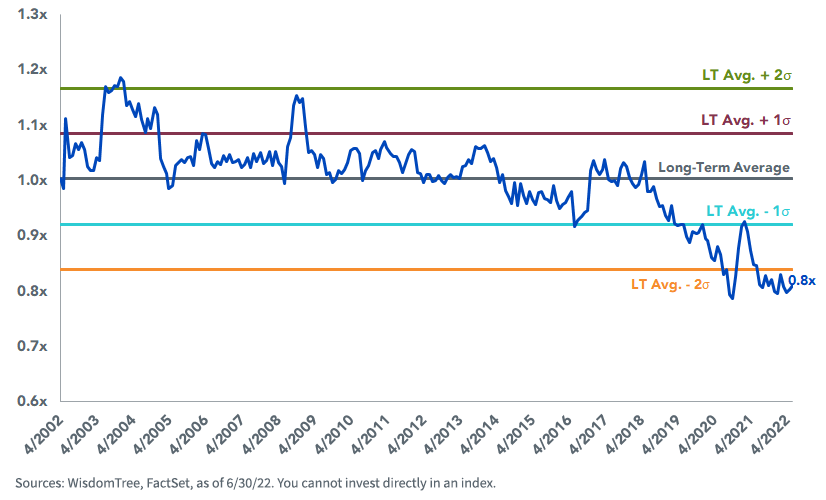
Historically, small-cap forward P/Es commanded about a 5% premium to large caps, though this relationship has steadily broken down in the last few years. After May’s market volatility, the forward P/E of the Russell 2000 compared to that of the Russell 1000 (a large-cap proxy) is less than its long-term average and comfortably less than two standard deviations below this average.
Russell 2000 Fwd. P/E (ex. Negative Earners) vs. Russell 1000
Their relationship with mid-caps is similar, reflecting investors’ fears that a recession will disproportionately affect smaller companies heavily dependent on the local economy.
Russell 2000 Fwd. P/E (ex. Negative Earners) vs. Russell Mid Cap
Are Better Returns Beyond the Horizon?
For those who believe a recession is imminent, it is understandably counterintuitive to dignify an asset class notoriously sensitive to economic growth amid rising interest rates and expectations of reduced earnings and profit margins. But for the intrepid small-cap investor, the future has historically looked bright after similar periods.
Over the past two decades, small-cap valuations have breached a 20% discount to their long-term average forward P/E on nine occasions (using monthly data). Over eight of these nine observations, small caps subsequently outperformed large caps over a two-year period by roughly 5% on average.
Forward Returns when Forward P/E Exceeds 20% Discount from LT Average
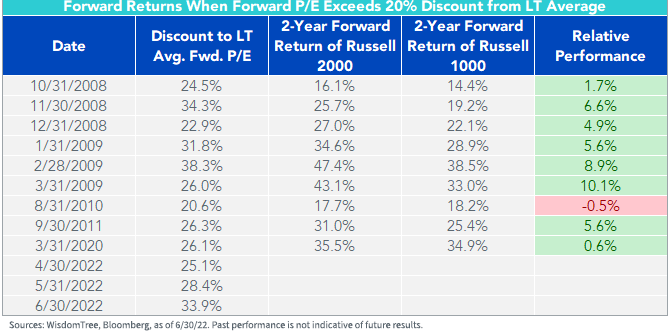
Many of these observations occurred in the wake of historical economic disasters, such as the global financial crisis and the onset of the COVID-19 pandemic. While we’re not anticipating economic calamity to those extents, history suggests a rosy outlook for small caps in the aftermath of a severe downturn.
Buy the Ticket, Take the Ride
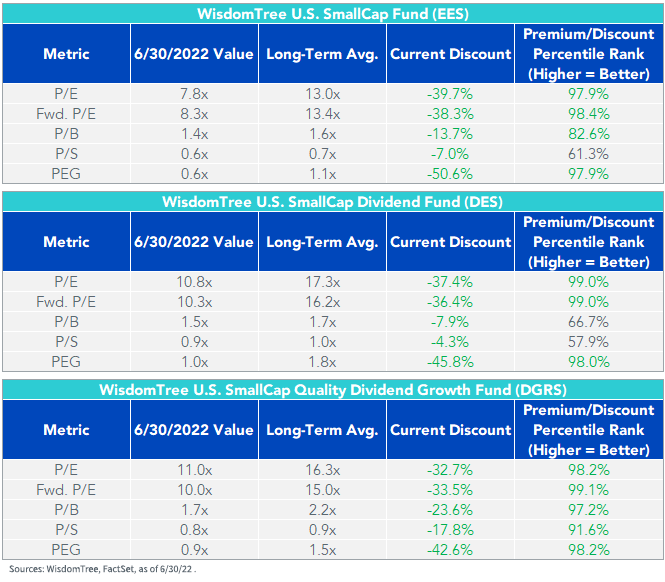
WisdomTree has preached the merits of small-cap equities since launching the WisdomTree U.S. SmallCap Dividend Fund (DES) in 2006. Since then, we’ve expanded our U.S. small-cap equity lineup to include the WisdomTree U.S. SmallCap Fund (EES) and the WisdomTree U.S. SmallCap Quality Dividend Growth Fund (DGRS) as well.
All three look attractive in today’s small-cap market, with valuations deeply below long-term averages and discounts among the lowest since each Fund’s inception.
If small caps behave in accordance with historical patterns in the aftermath of a downturn, these Funds may potentially catch a strong tailwind.
DES: There are risks associated with investing, including the possible loss of principal. Funds focusing their investments on certain sectors and/or smaller companies increase their vulnerability to any single economic or regulatory development. This may result in greater share price volatility. Dividends are not guaranteed, and a company currently paying dividends may cease paying dividends at any time. Please read the Fund’s prospectus for specific details regarding the Fund’s risk profile.
EES: There are risks associated with investing, including the possible loss of principal. Funds focusing their investments on certain sectors and/or smaller companies increase their vulnerability to any single economic or regulatory development. This may result in greater share price volatility. Please read the Fund’s prospectus for specific details regarding the Fund’s risk profile.
DGRS: There are risks associated with investing, including the possible loss of principal. Funds focusing their investments on certain sectors and/or smaller companies increase their vulnerability to any single economic or regulatory development. This may result in greater share price volatility. Please read the Fund’s prospectus for specific details regarding the Fund’s risk profile.
[ad_2]
Image and article originally from www.etftrends.com. Read the original article here.