

[ad_1]
JuSun/iStock via Getty Images
This old, bear market (NYSEARCA:SPY) is struggling to move higher and needs all the help it can get. It had some good news on inflation and consumer spending and maybe that is why we are seeing a positive, “higher-low” in price for the SPY. Last time this happened, in this bear market, price moved up to a “higher-high” and that would imply a target now of around $412.
Our Buy And Sell Alerts
Are we predicting that price is going to $412? No. We wait for the signals to tell us what to do next. We have set our buy alert at $396 and if that is triggered, we will wait to see if it reaches $404. If price breaks above $404, we may think about $412.
If price does reach that $412 level, does it mean that we are out of the bear market? Hardly. You can see it happened last time, and the bear continued on its downward path. If that happens again, we have sell alerts set up to trigger and prompt us to play the downside, just as the buy alerts prompt us to play the upside.
When this bounce tops out, as we expect it will, then we are looking at a retest of support at $364. We have a sell alert set at $362, and if that is triggered, we expect this bear market to continue down to test $341 by October. Are we predicting $341? No. We will let the signals tell us and act accordingly.
Short Term vs. Long Term
Below is the daily chart and we only use it to see the price trends and price action on a daily basis. On a day to day basis, price is reacting to every headline and that is why it is more important to look at the overall trendlines. As you can see, the trendlines are pointed down. The blue arrow is dropping even more sharply than the red arrow. That’s bearish. (We have also drawn support and resistance lines across the price chart.)
Little Bounce vs. Big Bounce
You can see price struggling to even reach these two, down trendlines. As you well know, bounces are going to struggle in a bear market like this. We could have a nice big bounce, that doesn’t struggle, if, for instance, the war ended. If inflation turned down from the 9.1% level just reported, that would create a nice bounce. Likewise, when the Fed stops raising rates, there will be a big bounce that would probably end this bear market.
None of these big bounces seem to be on the horizon, so we expect this struggling, little bounce to top out and turn down to retest support at $364. Short term, the signals are telling us that price will slowly move higher, testing resistance levels and support levels in a zig-zag move higher. We will wait for the signals to tell us when this bounce is finished and the market is once more ready to go down and form a bottom. We don’t see even the beginning of the formation of a bottom yet.
Long Term Downtrends
Here is the daily chart showing the downtrends. The signals show us how Demand and Supply are moving price from day to day. This daily swing in price is a bumpy ride to say the least:
Price Testing Red Resistance Line $387 (StockCharts.com)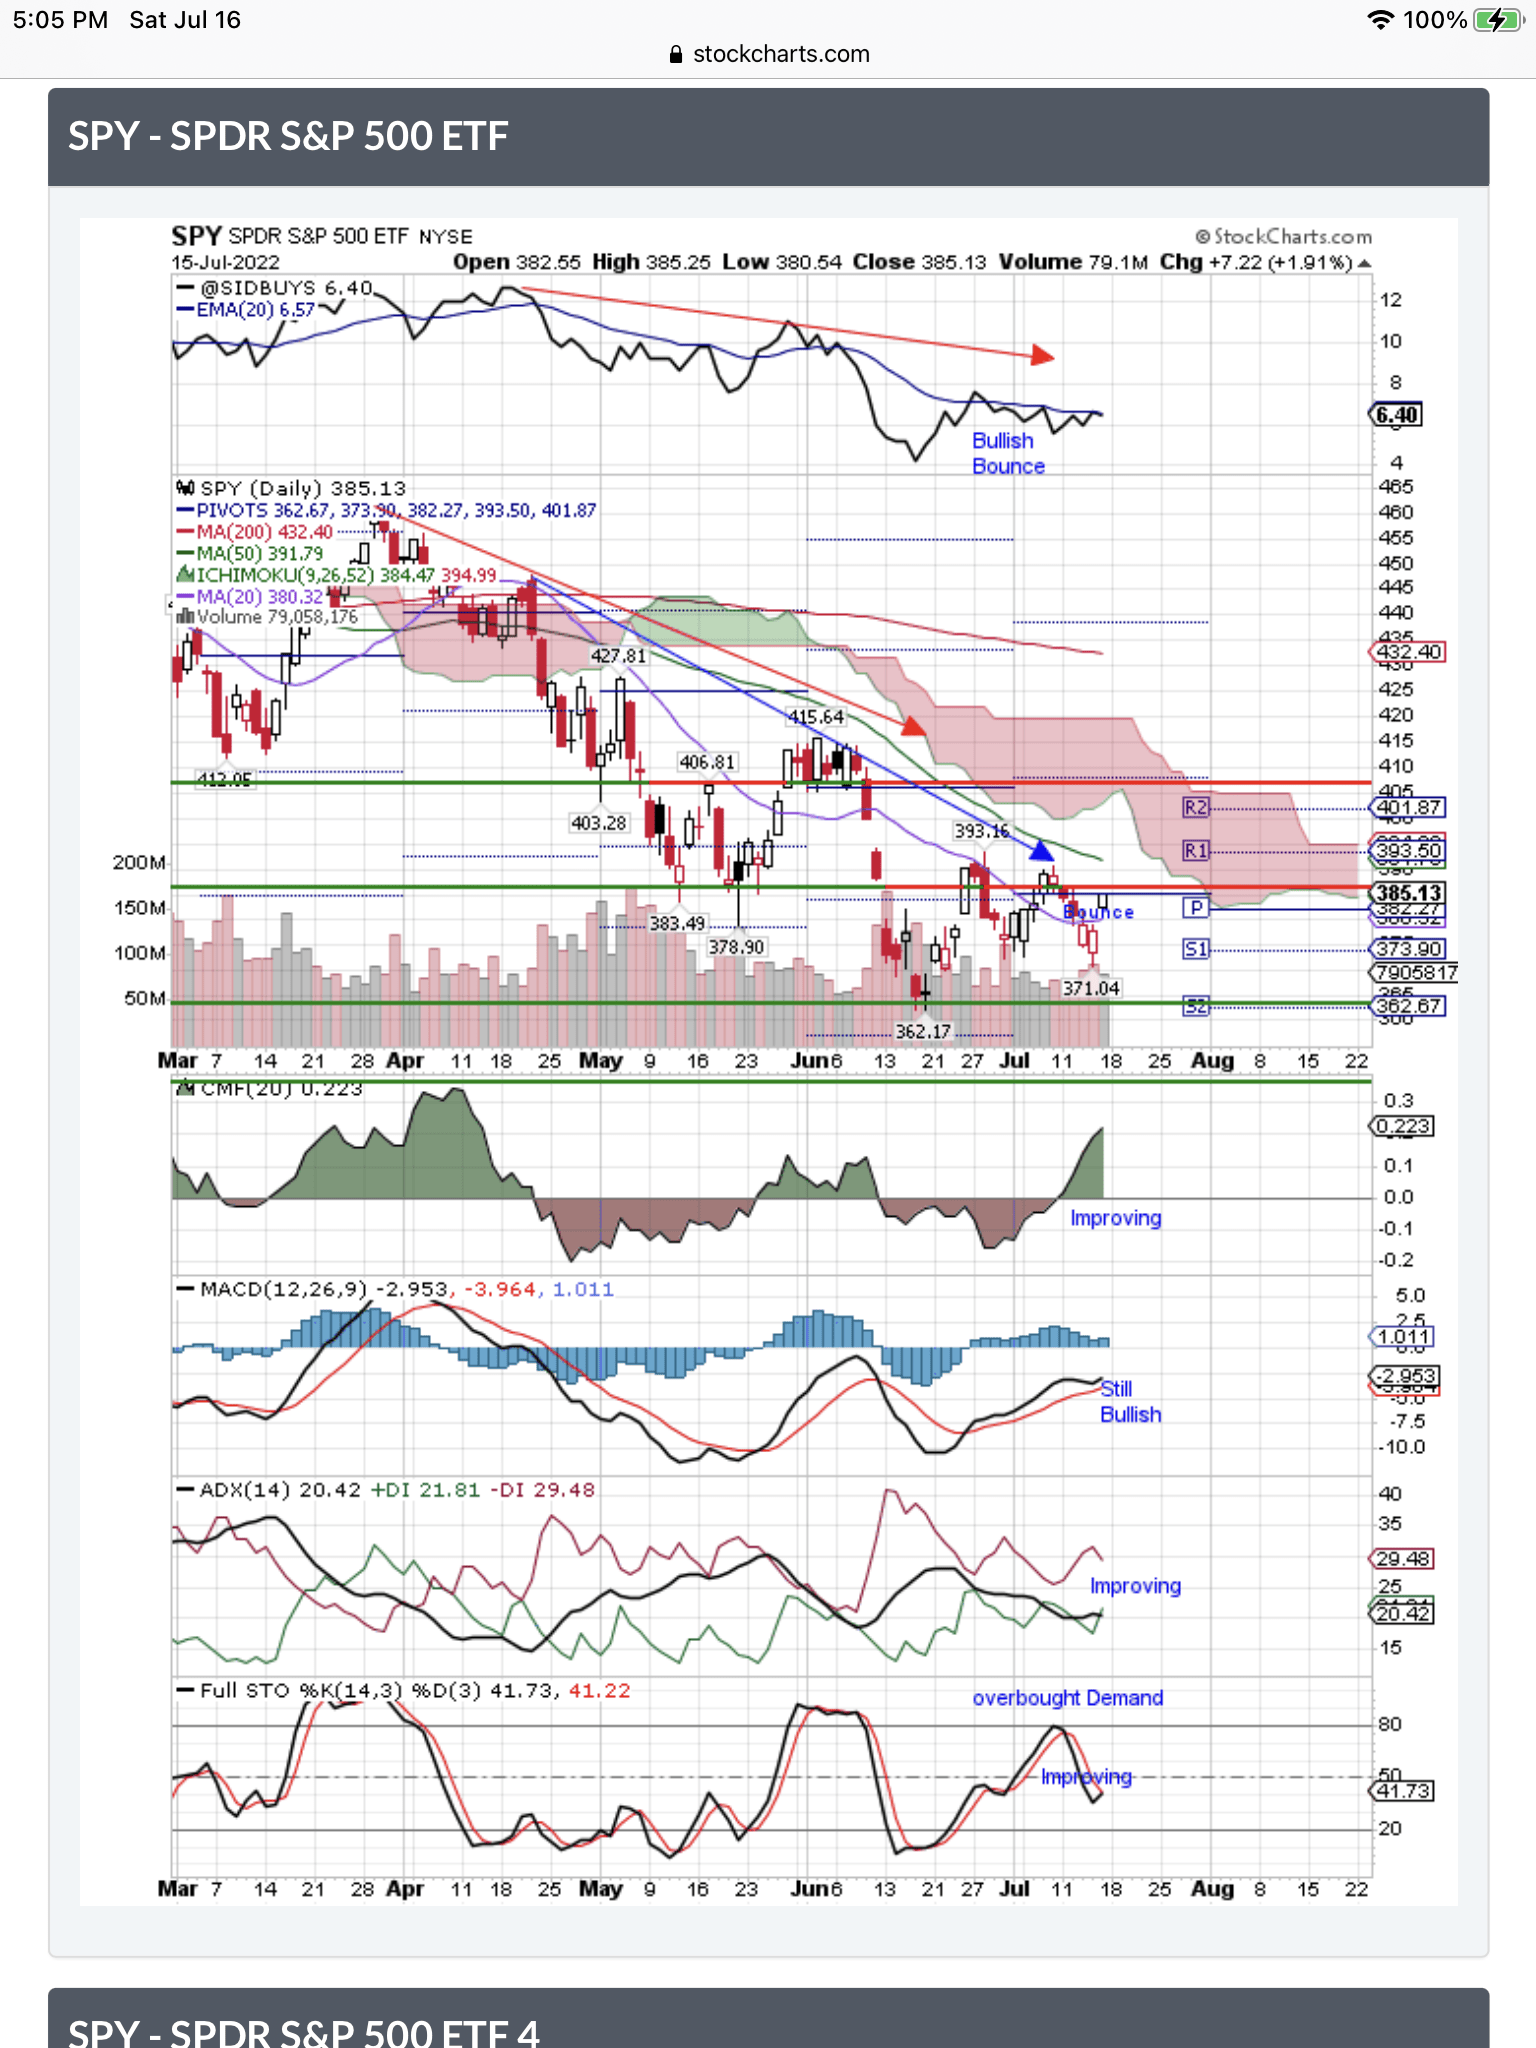
NOTE: On the above chart, you can see that CMF Money flow is in the green and still climbing. The MACD still has a Buy Signal. ADX is improving as Supply is dropping and Demand is improving. The Full STO has reversed and is moving up from Supply to Demand. Our proprietary signal SIDBUYS, at the top of the chart, shows that only 6.9% of stocks in the Index have our proprietary SID Buy Signal. This signal improved with this bounce. The “red cloud” outlines the resistance this move up is facing. Price is trying to reach that red cloud and not having much luck.
Higher-Low Bounce
Now let’s look at the more arcane Point & Figure chart where you can see the short term, higher-low, buy signal and I have underlined it in blue. Above this latest signal, I have underlined in blue the last time this happened. I circled the higher-high in price that it created. Let’s see if it happens this time.
Higher-Low Bullish Signal (StockCharts.com)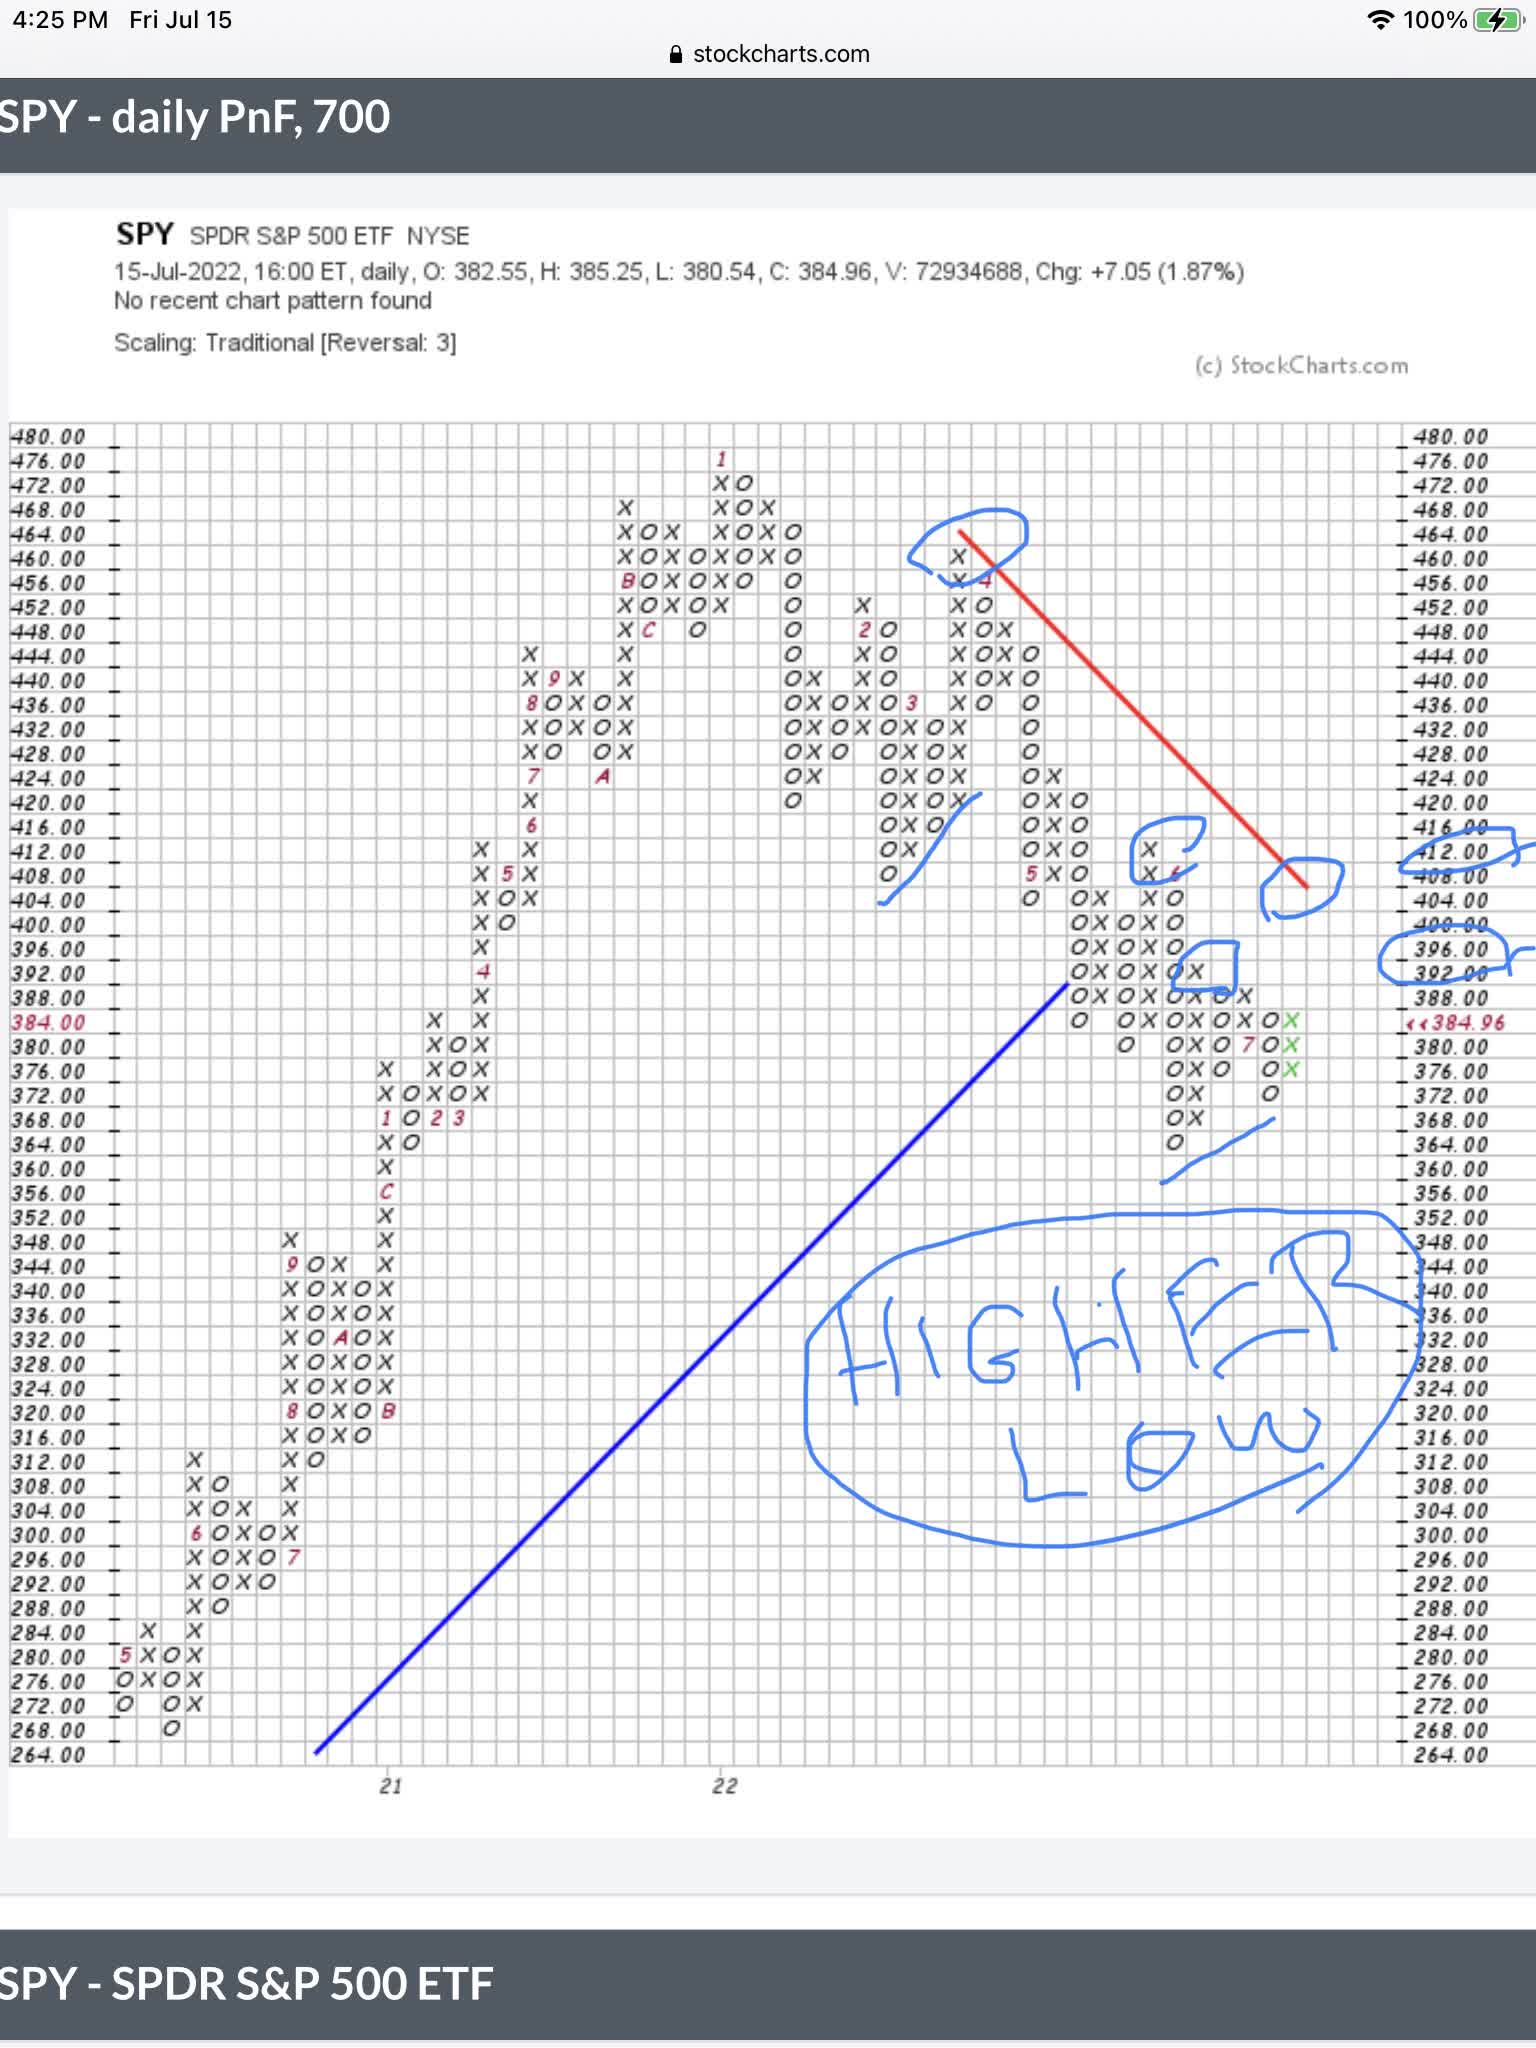
NOTE: On the above chart, the bearish “lower-highs” are still in place. That is the challenge for the Buy Signals we see on the above charts. Putting a higher-high in place next week at $392 is what we need to see on the chart. Otherwise the SPY drops back to test support at $372. That red line going down reminds us that the SPY is in a bear market, and a bounce like this one is going to have a tough time moving higher. That is why we keep seeing the price reversals on this chart.
[ad_2]
Image and article originally from seekingalpha.com. Read the original article here.