
[ad_1]
adventtr
Thesis
2022 has been challenging for investors. All major asset classes have suffered substantial losses as you can see from the following chart. To wit, gold held up the best, suffering a loss of only 3.3% in the past years. Equity suffered more, about 7.5%. And treasury bonds, depending on the maturity, suffered to various degrees. Extended duration bonds such as those in TLT, suffered price corrections of more than 25%.
Silver is one of the most beaten-down asset classes. Using the Sprott Physical Silver Trust (NYSEARCA:PSLV) as an example, it suffered a loss of 21% in the past year. And the thesis of this article is that such an outsized correction has brought an attractive entry opportunity for investors. Further, I will argue that it is among the most attractive entry points in almost 2 decades for the following reasons to be elaborated on in the remainder of the article:
- Silver price now approaches production cost
- Dollar index strength is near its 20-year peak
- Gold-silver price ratio is near its 20-year peak too.
Yahoo Finance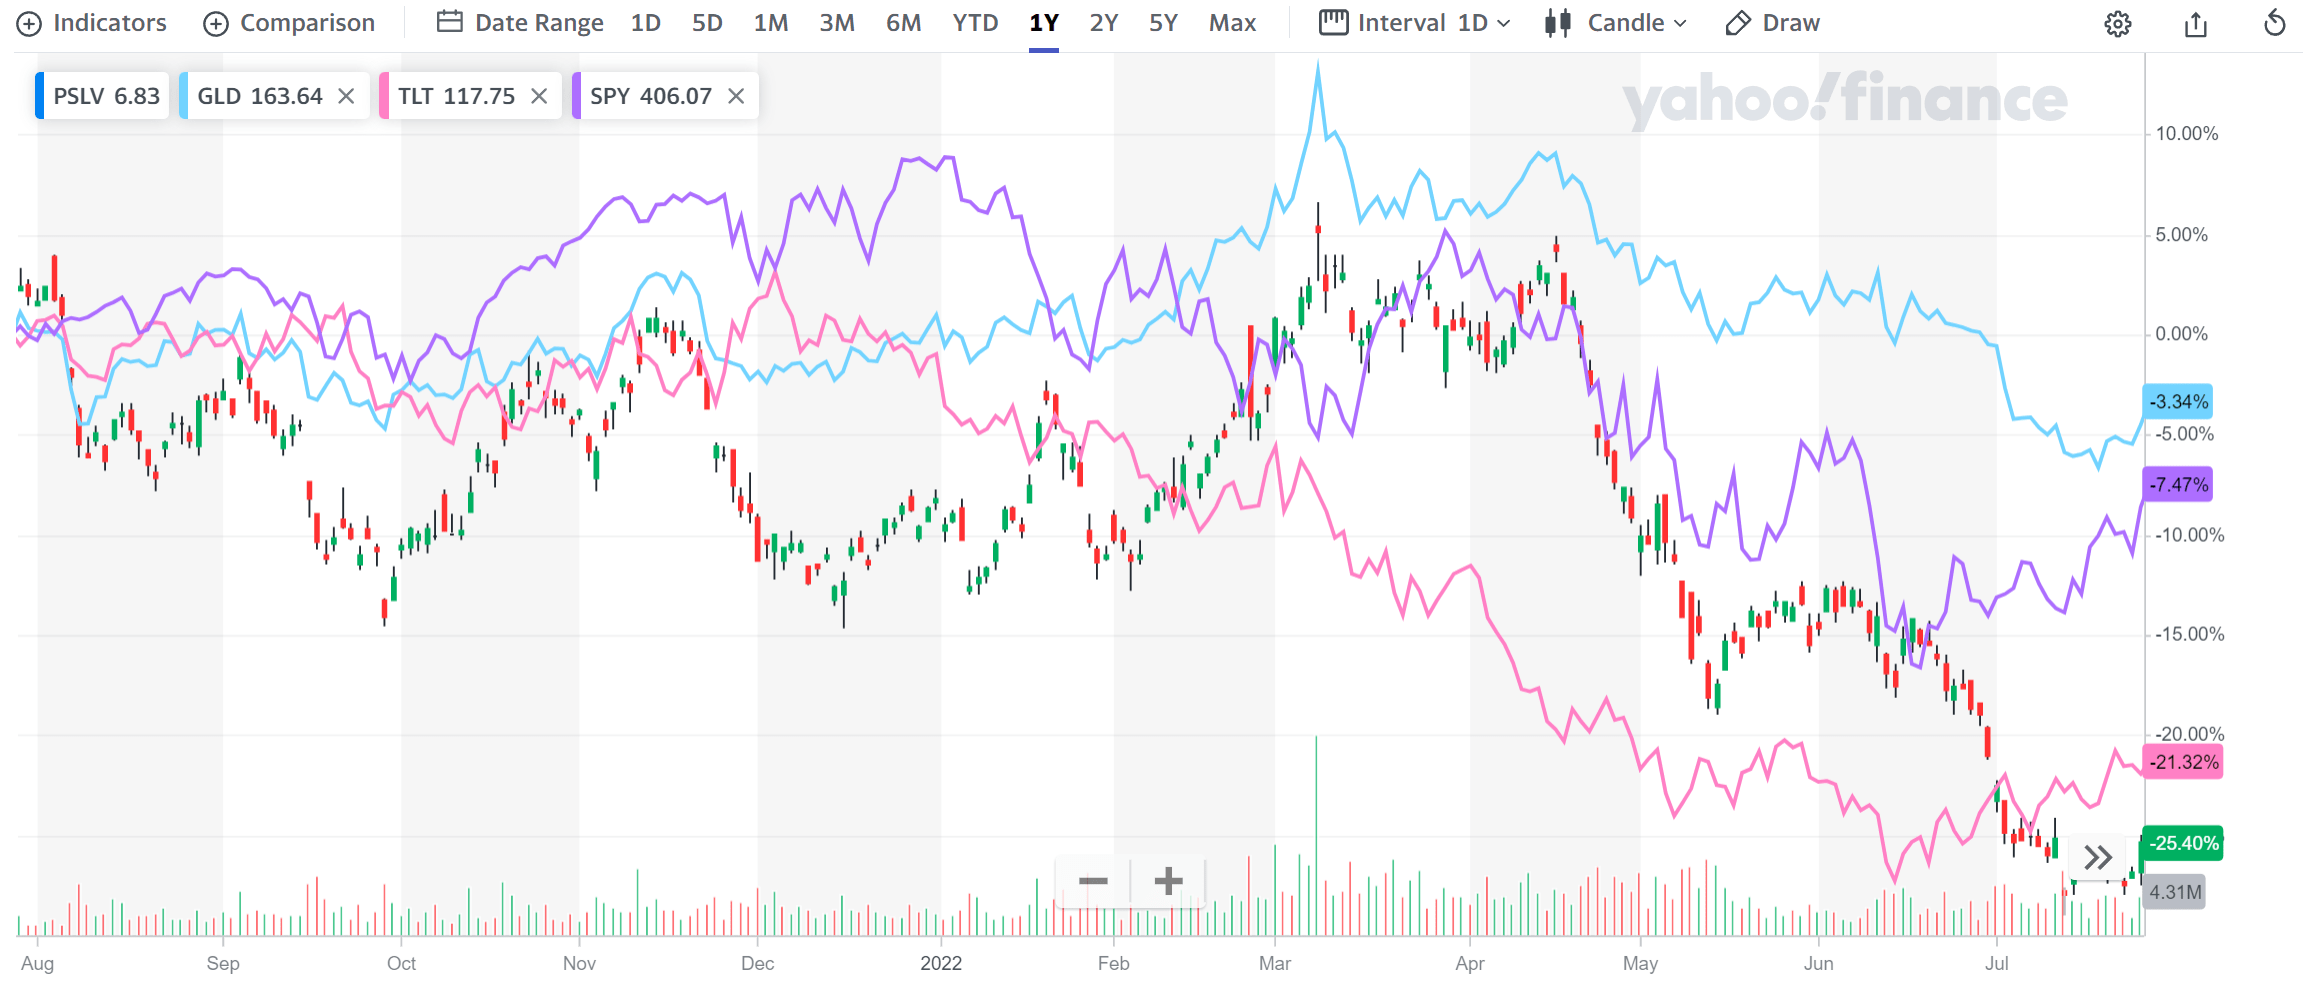
PSLV basic information
PSLV is a Closed-End Trust in the Sprott Trust family. It invests in unencumbered and fully-allocated London Good Delivery (“LGD”) silver bars. Its bullions are held in custody at the Royal Canadian Mint and are audited by KPMG periodically. In exchange for its trustworthy storage and convenience of trading (and also it’s redeemable for metals), investors pay a 0.6% expense fee (more on this later).
Sprott Physical Silver Trust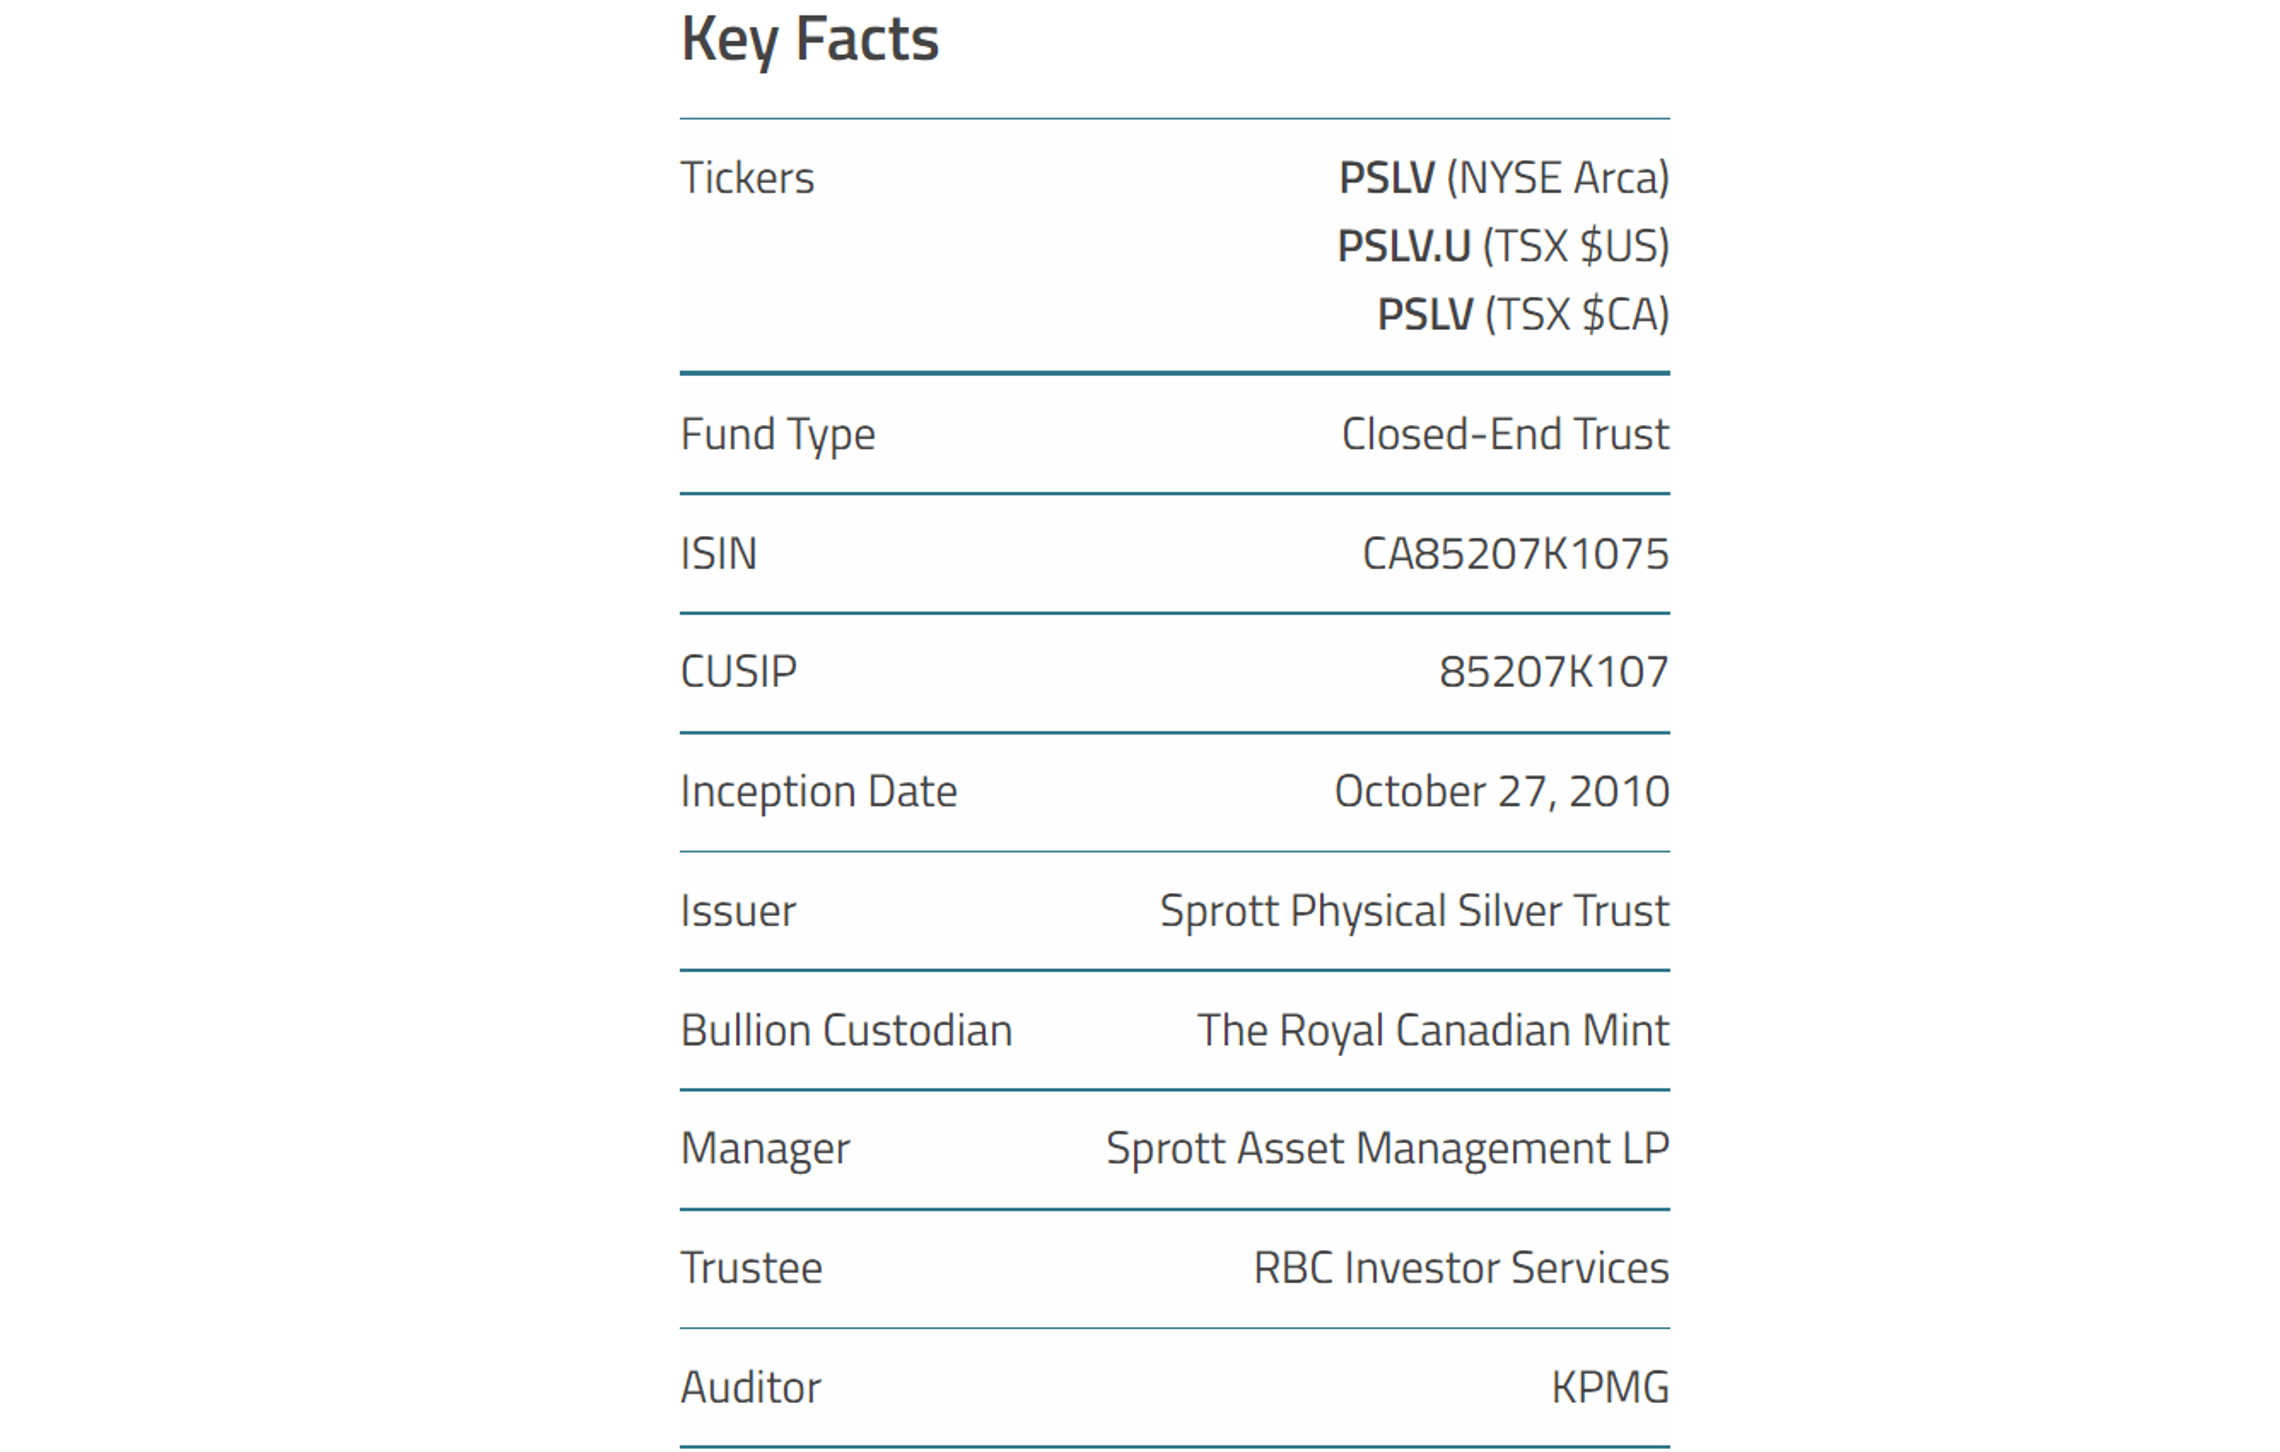
Silver price approaches cost
Silver mining is a tough business – both in the physical sense and in the financial sense. In terms of the financial challenges, silver miners have to overcome environmental, geological, and political challenges to extract silver and control their cost to be (hopefully) below the selling prices. The costs obviously vary from miner to miner depending on the challenges they face. The table below provides some examples to provide an idea of the variance. As you can see, the all-in cost back in 2015 and 2017 ranged from $17.2 to $9.0.
Only adjusting for inflation since then, these numbers would translate to about $12.5 to $21.4 in today’s dollars based on my calculations, already approaching the current silver spot price of $20. And the real cost escalation should be substantially higher than my inflation adjustment. For example, in fiscal 2022 alone, China-focused mining company Silvercorp Metals (SVM) reported a 17% surge in its consolidated cash production cost compared to 2021.
Source: www.americanbullion.com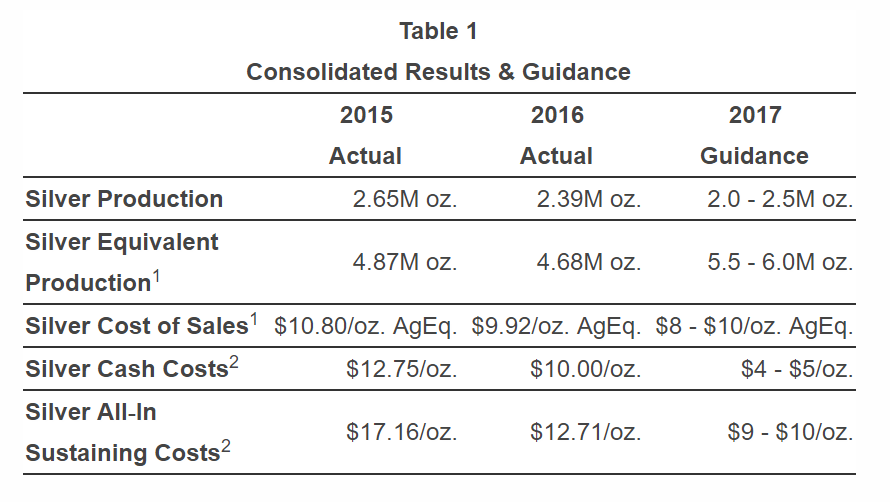
Dollar strength near 20-year peak
Because silver prices are expressed in dollars, dollar strength artificially suppresses silver prices (regardless of where and how much the silver production takes place). As you can see from the chart below, currently the dollar strength stands at 107.08, the highest level in about 20 years due to the Fed’s rate raises to fight inflation. Looking forward, I see further strengthening unlikely based on the following arguments detailed in my other article here, which will provide a catalyst for silver price to rebound.
I see short-term treasury rates (1-year, 2-year, and 3-year) have all reached their target ranges already. These rates have all reached their target range already in my view. The short-term rates are currently high enough to cause a yield curve inversion already. As a result, the dollar strengthening is losing steam as we go forward. And furthermore, I see unfolding geopolitical developments (such as China systematic reduction of its dollar assets) to further mute its strengthening.
Source: investing.com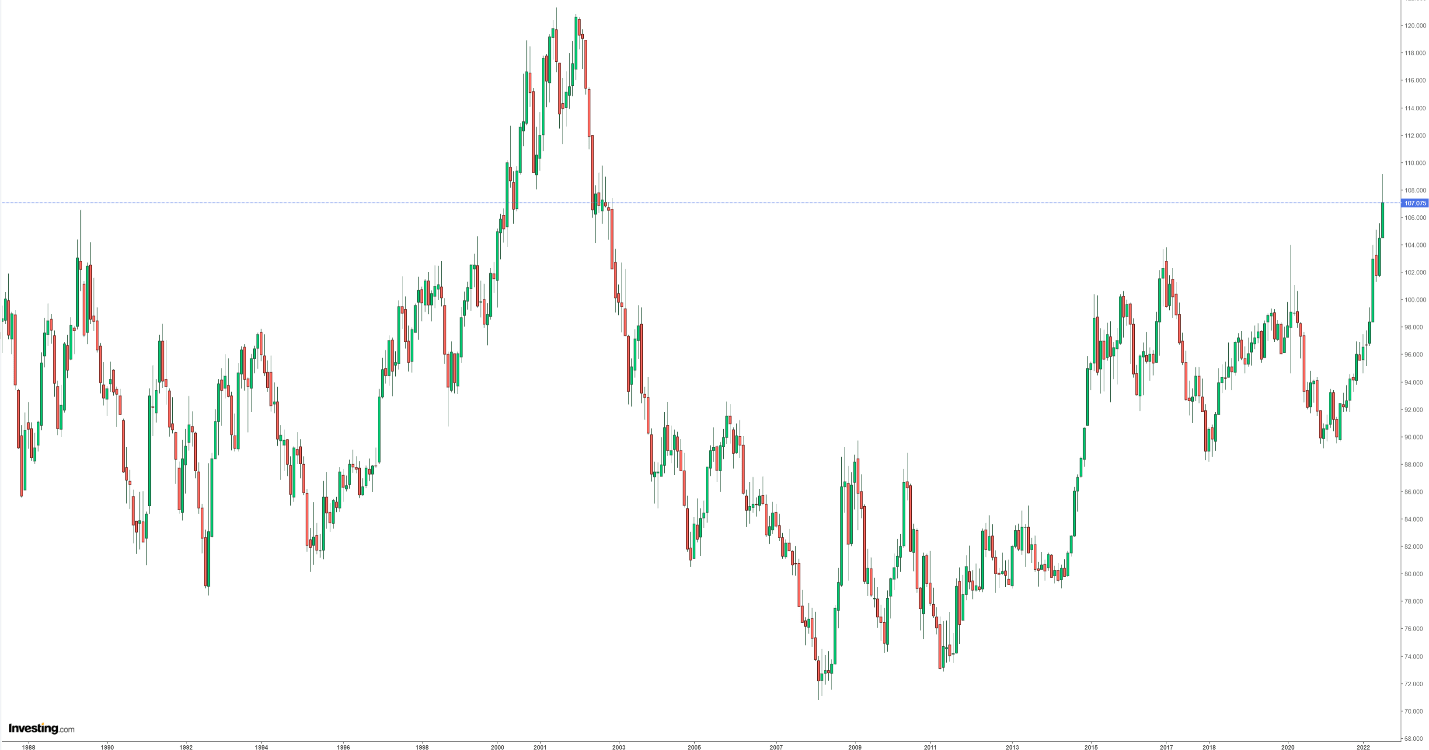
Gold-silver price ratio near 20 year-peak
Finally, for investors interested in a gold-silver trade, now is also among the most attractive time in about 20 years to do so. As seen from the following chart, the current gold-silver price ratio stands at 89.05x. It is the highest level since 1991, except a brief peak occurred during 2020.
Source: www.longtermtrends.net/gold-silver-ratio/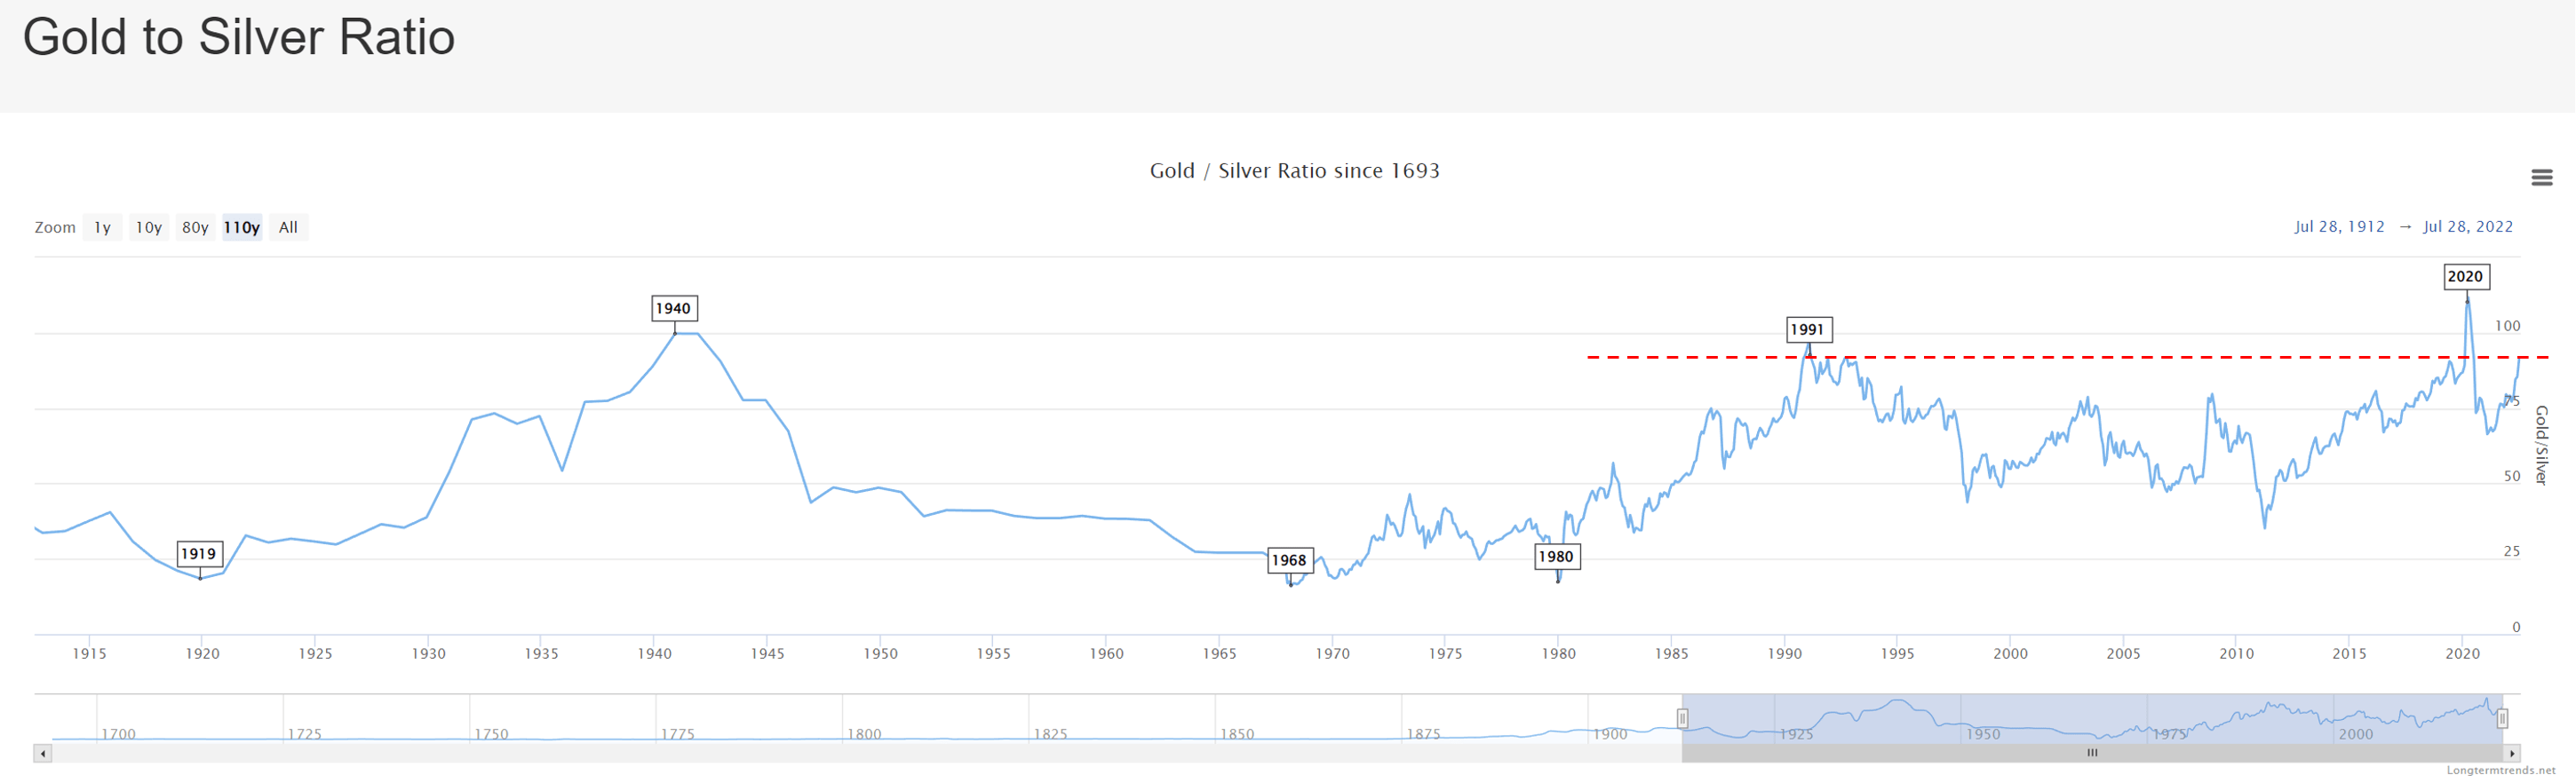
Final thoughts and risks
In summary, the thesis of this article is to argue that now is a good time to consider silver for your portfolio. My key considerations are threefold. First, my estimate is that silver price now approaches production cost. Second, the dollar index strength is near its 20-year peak, and I see further strengthening unlikely from here on. Finally, the gold-silver price ratio is near its 20-year peak too, providing an appealing setup for trading between these two precious metals.
Our current silver and gold holdings are shown below. As you can see, we are actually holding Aberdeen Standard Physical Silver Shares ETF (SIVR) for our silver exposure. The main consideration is the expense ratio. SIVR charges a 0.3% expense ratio, which is exactly half of PSLV’s 0.6%. And this brings me to the risks of owning PSLV.
As a non-yielding asset, PSLV’s expenses always create a fee drag. Its 0.6% fee may seem negligible in absolute terms. But its total return potential has been typically a few percent per year in the long run (say 6%). From this perspective, a 0.6% fee is already 10% of the total return potential. Also, investors need to be aware of PSLV’s extreme price volatility. As aforementioned, PSLV suffered a total loss of more than 21% in the past year alone.
Author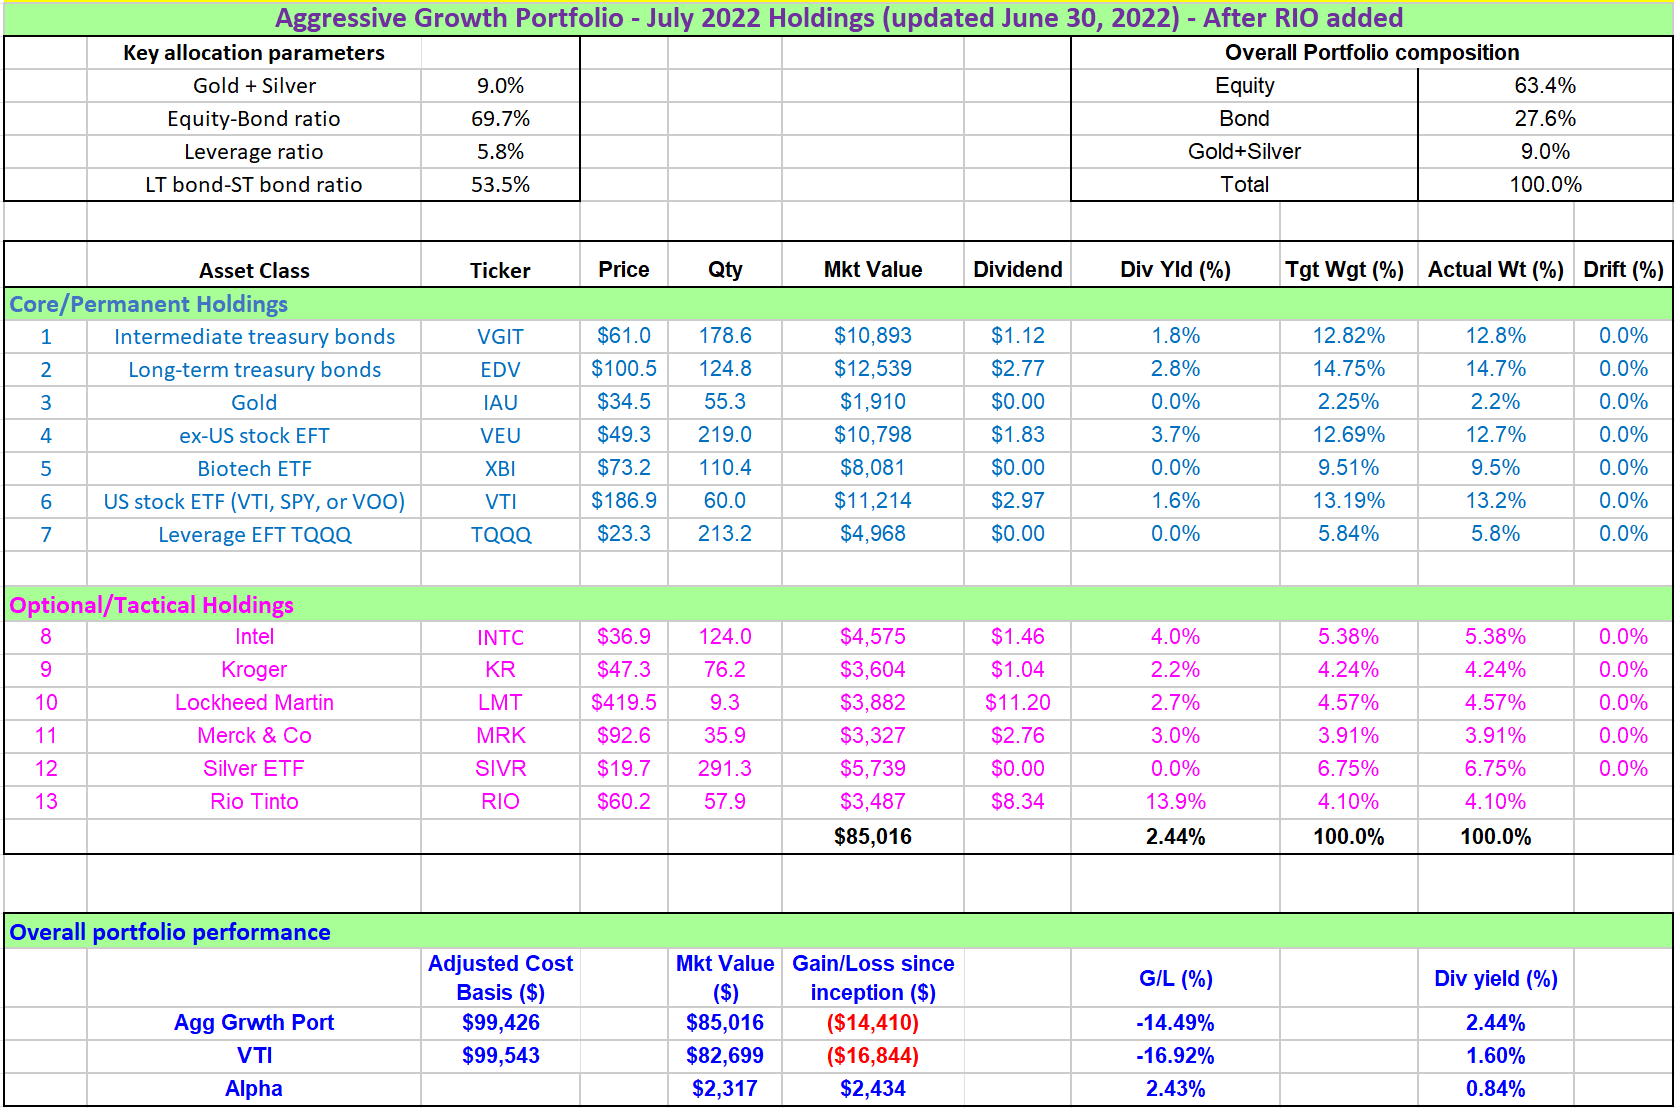
[ad_2]
Image and article originally from seekingalpha.com. Read the original article here.