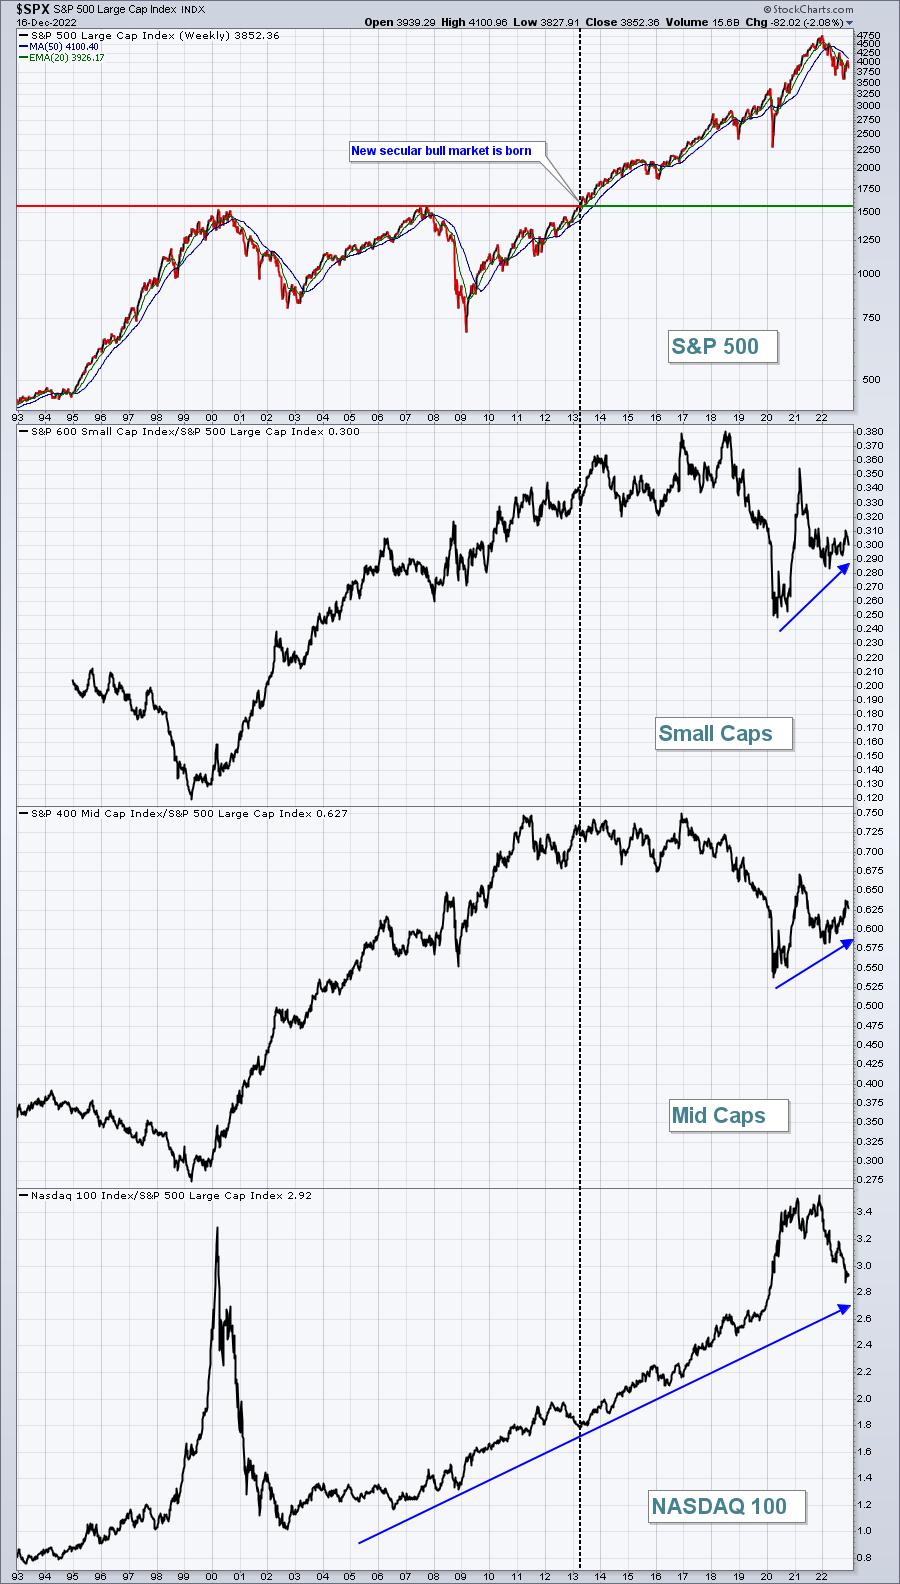
Since the S&P 500 broke out above price resistance established in 2000 and 2007, the secular bull market rally has been led by the NASDAQ 100’s influence. If we compare relative performance (to the benchmark S&P 500), small caps and mid caps have been quite unreliable, while the NASDAQ 100 has clearly been the steady leader:
The black-dotted vertical line is drawn at roughly April 2013, when the S&P 500 finally broke out of that miserable consolidation and secular bear market pattern that began in year 2000. In the bottom panel, you can see that the NASDAQ 100’s relative strength was the driver until the end of 2021.
But what about small caps. They actually performed extremely well after the pandemic began and into 2021 as they soared on a relative basis. After hitting a relative bottom during Q1 2022, small caps have once again been uptrending. Another way to view this relative strength is with RRG charts. Below are daily and weekly RRGs:
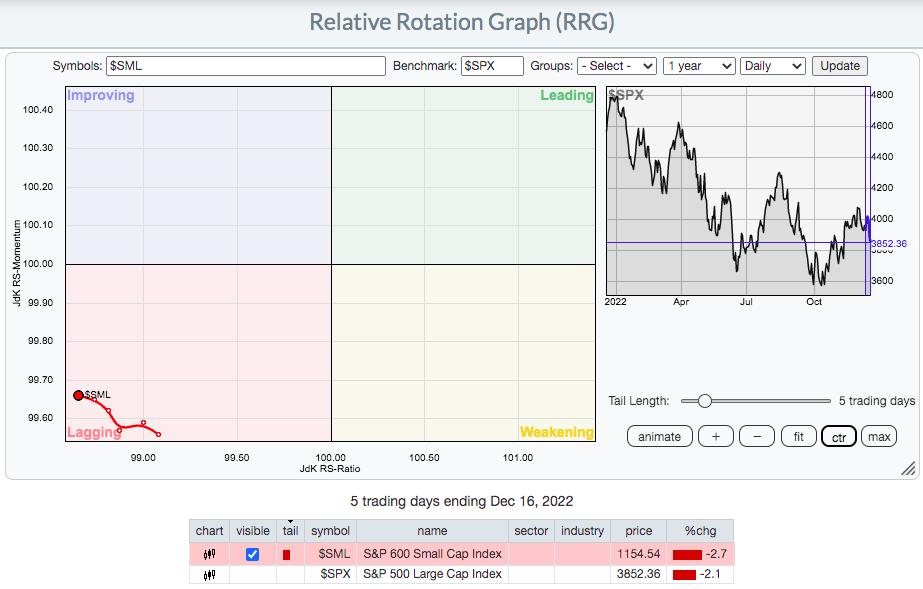
Daily RRG: Small caps vs. S&P 500:
Weekly RRG: Small caps vs. S&P 500:
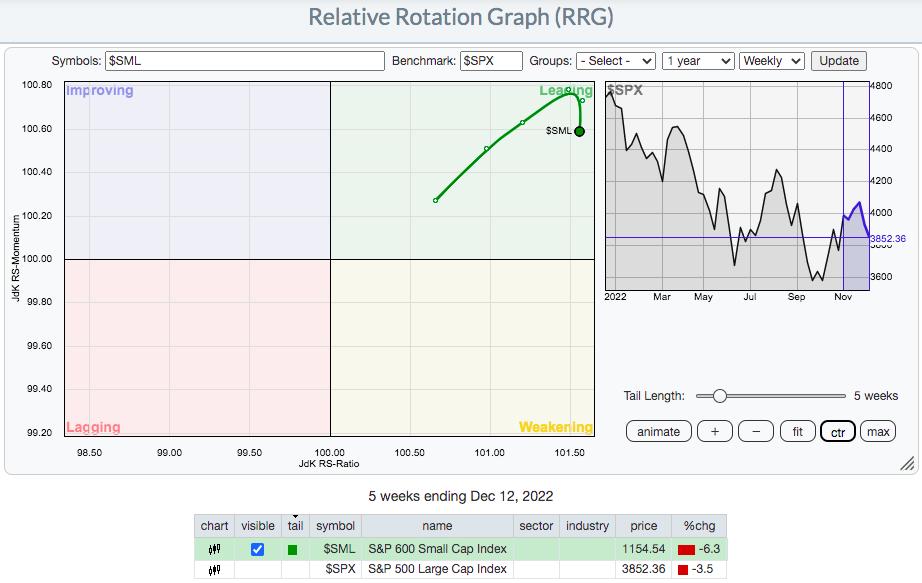
These two RRGs tell different stories. The daily chart shows that small caps have been lagging in recent action and are currently in the bottom left “lagging” quadrant. But the longer-term weekly chart shows this same asset class in the upper right “leading” quadrant. So the question becomes, “is the recent weakness just a bit of relative profit taking?
Well, for me, it comes down to the absolute price chart and I like to view the daily price action. So let’s check that out on the $SML:
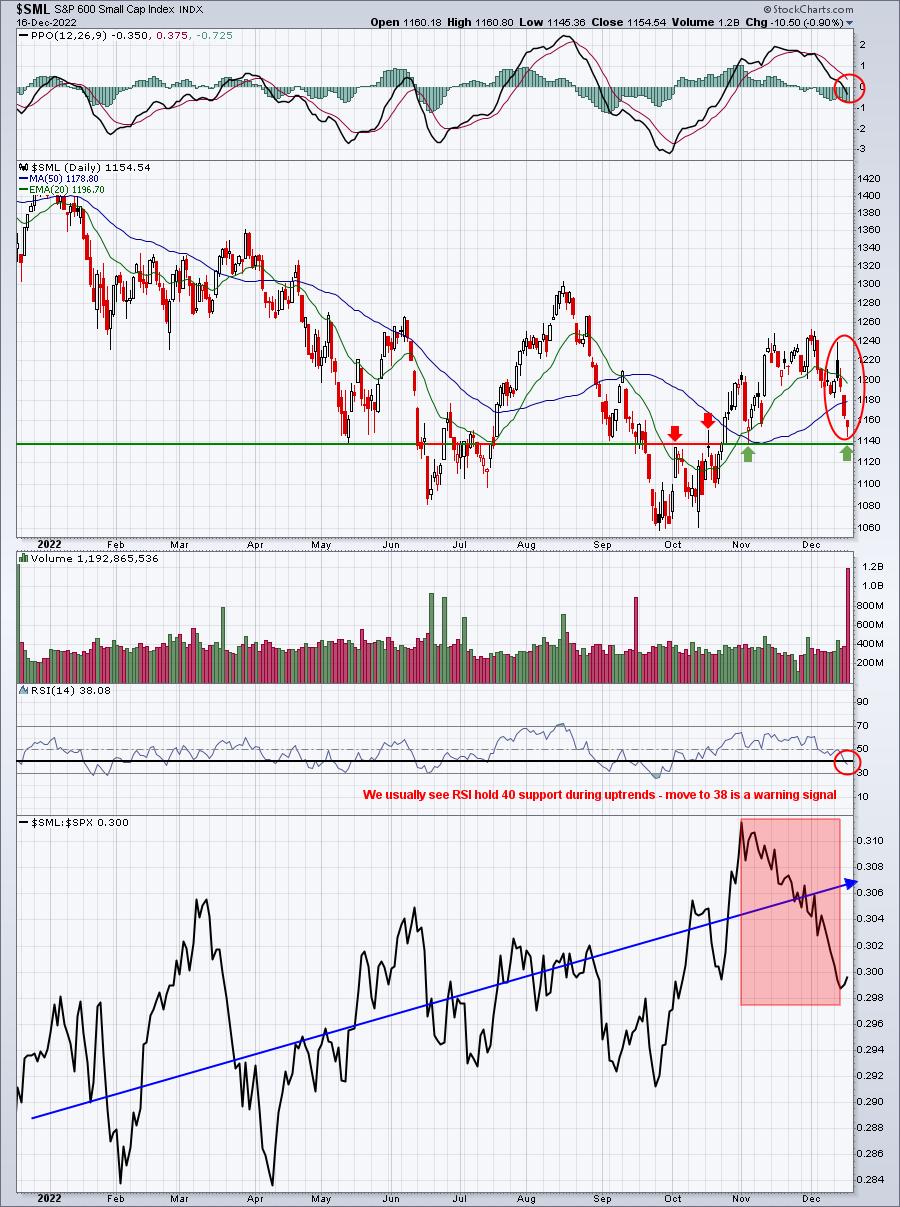
The red circles/ovals are all problematic and potential warning signs. The daily PPO has crossed its centerline in bearish fashion. Price action, after nearly breaking out earlier this week, has since lost both 20-day EMA and 50-day SMA support. The RSI has moved beneath 40. These are all signals that a downtrend could be resuming. The two positives I see are the overall relative uptrend (bottom panel) and the fact that key price support just below 1140 hasn’t been lost.
At this point, I’d still consider small caps to in the bullish camp. But we’re seeing current deterioration, and if price support is lost, the odds suggest we’ll be moving lower.
On Saturday, January 7th, EarningsBeats.com will be hosting our 4th annual MarketVision event – “MarketVision 2023 – The Road Ahead: Navigating an Uncertain Market”. It’s a FREE virtual event and everyone is invited. My good friends, Dave Keller, Grayson Roze, and Julius de Kempenaer from StockCharts.com, will be joining me for a very educational event. Did I mention it’s FREE – with no credit card required? CLICK HERE for more information and to register NOW. Because it’s free, we’re very likely to reach room capacity, so SAVE YOUR SEAT TODAY! I’ll see you the 7th!
Happy trading!
Tom