
SPX Monitoring Purposes: Neutral.
Monitoring Purposes GOLD: Long GDX on 10/9/20 at 40.78.
Long Term SPX Monitor Purposes: Neutral.
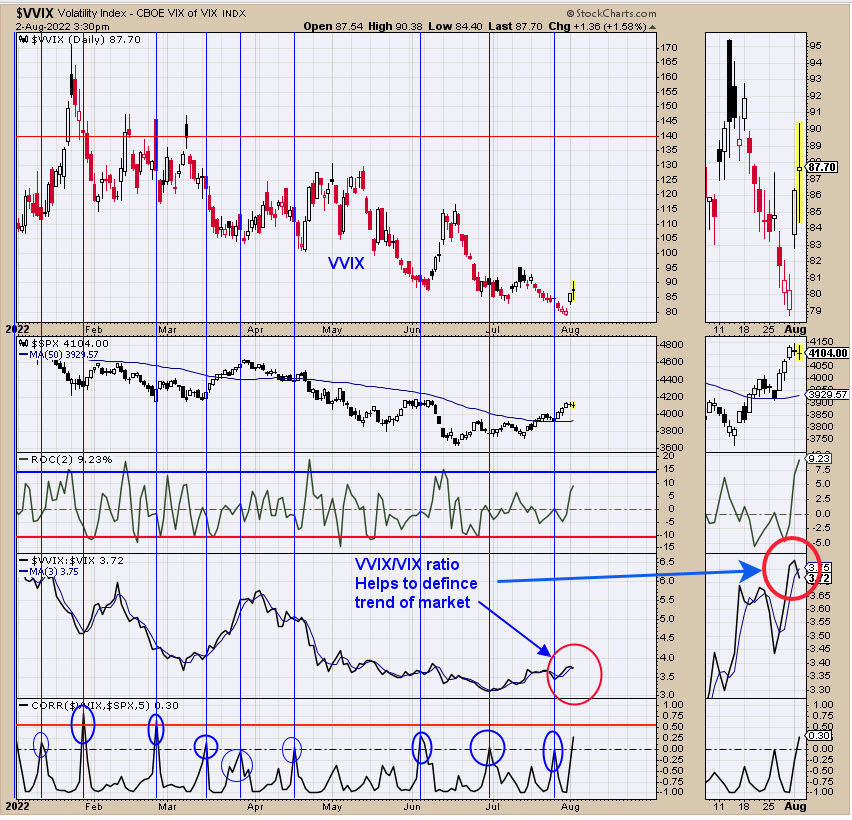
The bottom window is the correlation between the VVIX and SPX 5-period. When this correlation gets over .00 (currently .30), the market can be near a reversal. The next window up is the VVIX/VIX ratio with a 3-day average. This indicator helps to define the trend, and it turned down today. Next window up is the “rate of change” (ROC) of the VVIX. When the ROC of the VVIX is near -10, the SPX can be near a short term high (currently at +9.72). The market has at least stalled on the rally phase. The bigger picture suggests the mid-June low could be the bottom for this year. Staying neutral for now.
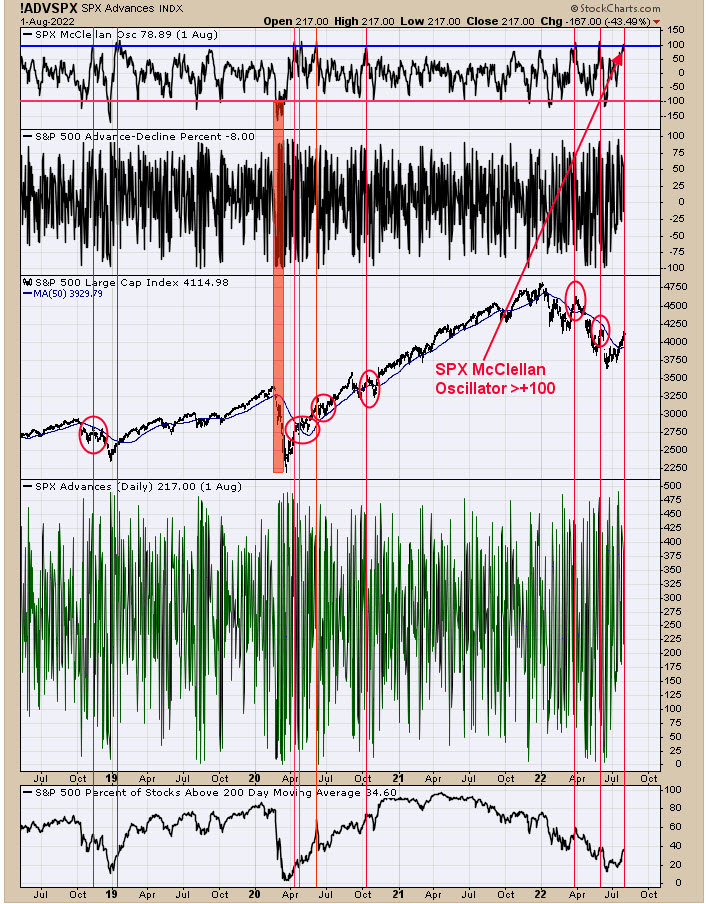
The top window is the SPX McClellan Oscillator. This chart goes back to mid-2018 and shows the times when the SPX McClellan Oscillator traded above +100, identified with red vertical lines. On July 29 of this year, the SPX McClellan Oscillator closed at +100.57. The SPX Oscillator hit +100 eight times (not counting this time) going back to mid 2018, and all but one had either a short term pullback or at least traded sideways for at least a couple of weeks. As mentioned before, the market has interred into the 3rd quarter, which is the weakest quarter of the year. The evidence suggests the market is entering into a trading range that may last most of the third quarter.
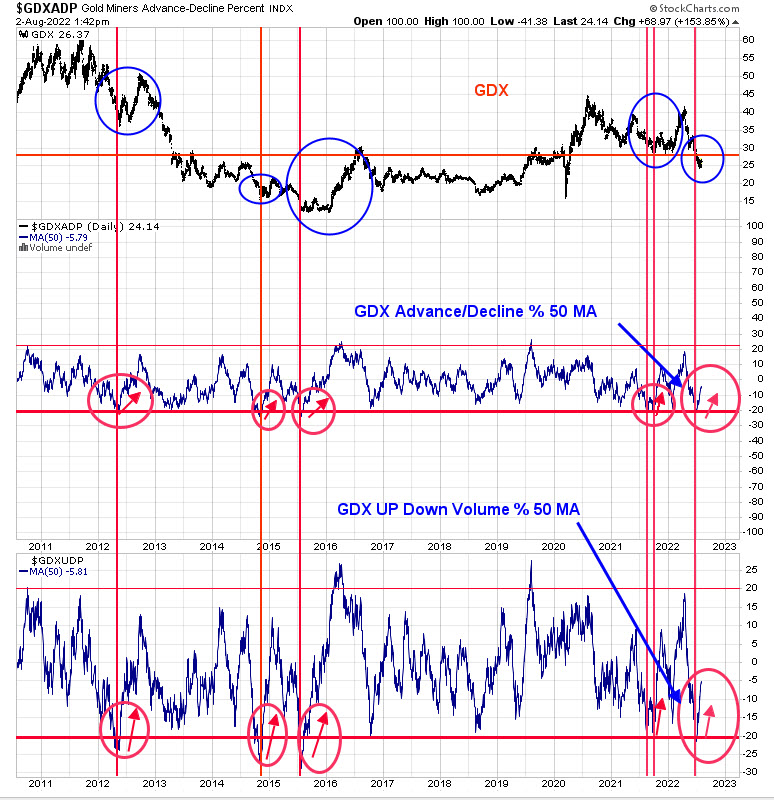
Above is one of the indicators that is giving an intermediate-term signal. The bottom window is the 50-day average for the Up Down Volume percent, and the next window up is the 50-day average of the Advance/Decline percent. Intermediate-term lows have formed when both indicators traded below -20 and turned up, which are noted with red vertical lines. The previous signals have led to a sideways or up and down pattern before the rally began, and that condition suggests that may happen here. Notice that, when both indicators reached below -20 and turned up, they continued to advance even though GDX traded sideways. We attribute this to the strengthening in the Gold Miners Index bullish percent index, where more stocks produced Point and Figure buy signals. The evidence point to a base-building bottom that may take several weeks for the rally to get going.
Tim Ord,
Editor
www.ord-oracle.com. New Book release “The Secret Science of Price and Volume” by Timothy Ord, buy at www.Amazon.com.
Signals are provided as general information only and are not investment recommendations. You are responsible for your own investment decisions. Past performance does not guarantee future performance. Opinions are based on historical research and data believed reliable, there is no guarantee results will be profitable. Not responsible for errors or omissions. I may invest in the vehicles mentioned above.