
[ad_1]
Kameleon007
Bonds are the first asset class to do well as the economy slows into a recession. Market movements after Wednesday’s record-high 9.1% CPI suggest the Treasury market is pricing in a recession and lowering inflation expectations.
Specifically, the recent uptrend for bonds and downtrend for commodities means the Treasury market expects the Fed to raise interest rates until inflation is definitively broken. Therefore, the market is warning of an imminent disinflationary recession.
If this occurs, the iShares 20+ Year Treasury Bond ETF (NASDAQ:TLT) has room to increase 100%, while falling prices for stocks, commodities, and housing should continue.
TLT Technical Analysis
Looking at price action over the past few days, TLT appears to be starting a new uptrend. After a 7-month downtrend and 1.5-year bear market, TLT now has immense upside potential.
TLT:USD – 1D (TrendSpider)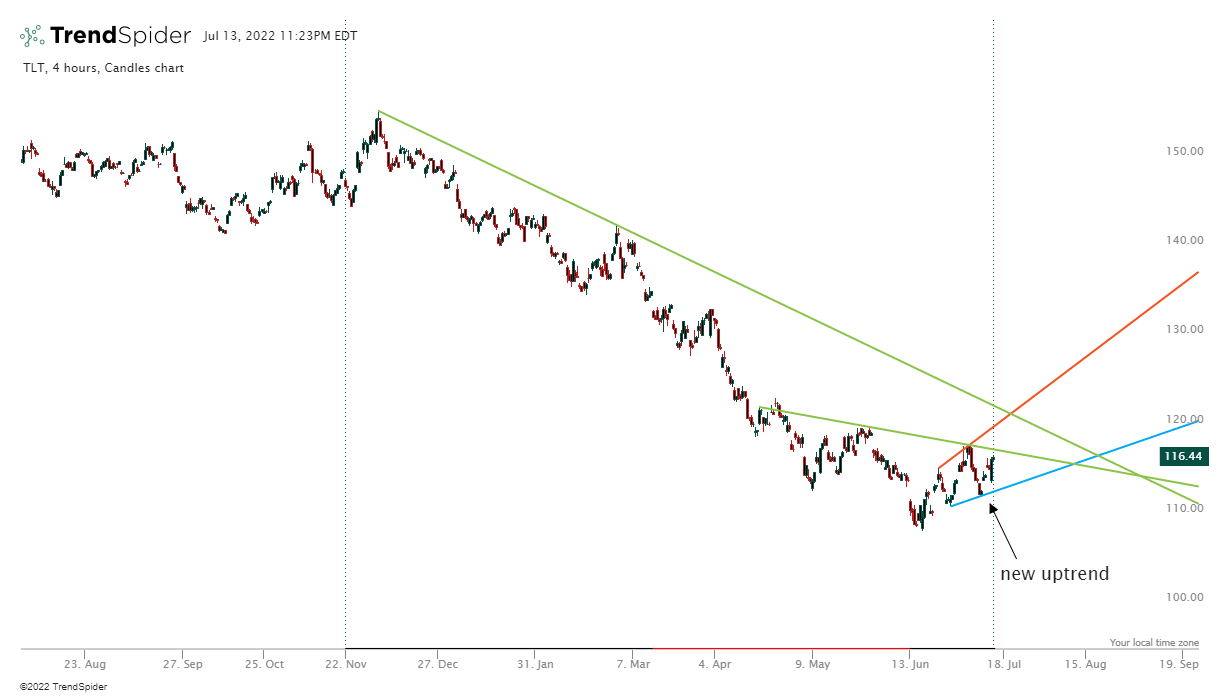
Notably, TLT moved bullish (+2.8%) during June’s record-high CPI inflation print on Wednesday, 7-13-2022. In our view, this indicates the Treasury market expects a peak in inflation and a recession to begin.
By analyzing TLT’s long-term Elliott waves, we can see that the ETF’s bear market (which began in March 2020) may finally have ended. Currently, TLT is down about 35% from its March 2020 all-time high.
TLT:USD – 3D (TradingView 7-13-2022)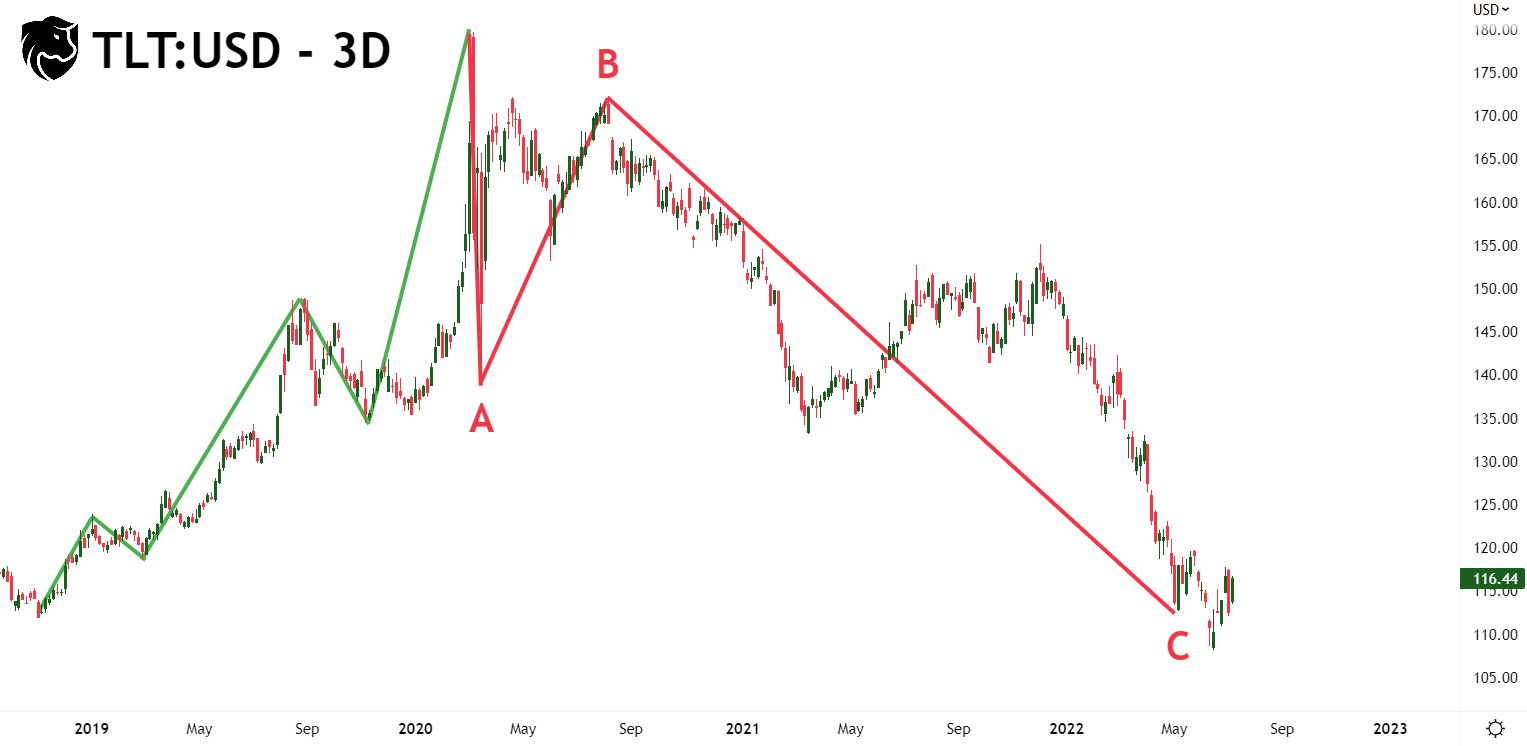
As the price of TLT increases, the likelihood of a US economic recession also increases. During a recession, investors seek safety and shift into high-quality bonds and defensive sectors such as utilities, healthcare, and consumer staples.
Currently, macroeconomic conditions are positioned correctly for a bond rally, and TLT appears ready to pop. If TLT retraces its 2022 losses, this will bring the ETF back to $150.
On its monthly chart, TLT is moving in a massive upward sloping channel between a $215 – $150 ceiling and a $100 floor. From this perspective, now looks to be a beneficial time to begin dollar-cost-averaging into long-term bonds.
TLT:USD – 1M (TrendSpider)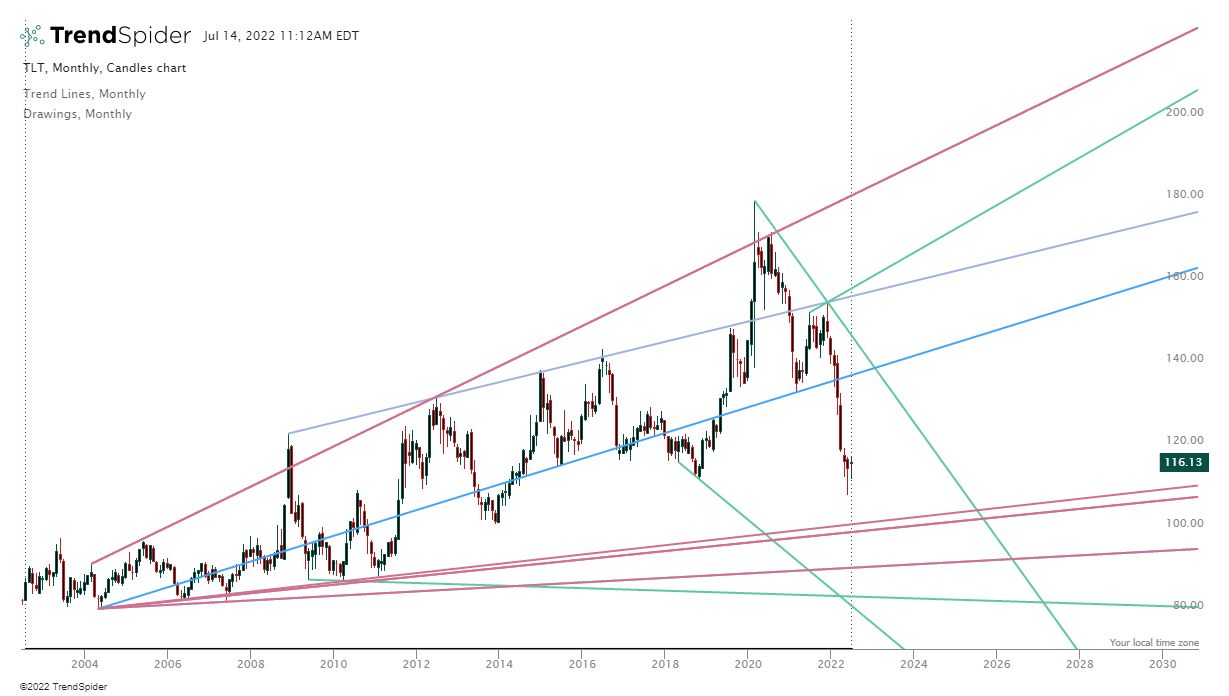
Where Are We In The Business Cycle?
Identifying where the market is positioned in the business cycle helps investors determine when the bear market is over and when stocks and commodities become safer to invest in. From a theoretical perspective, the intermarket business cycle predicts the price of bonds, stocks, and commodities as three interwoven waveforms:
Intermarket Business Cycle (International Review of Economics and Finance (annotated by author))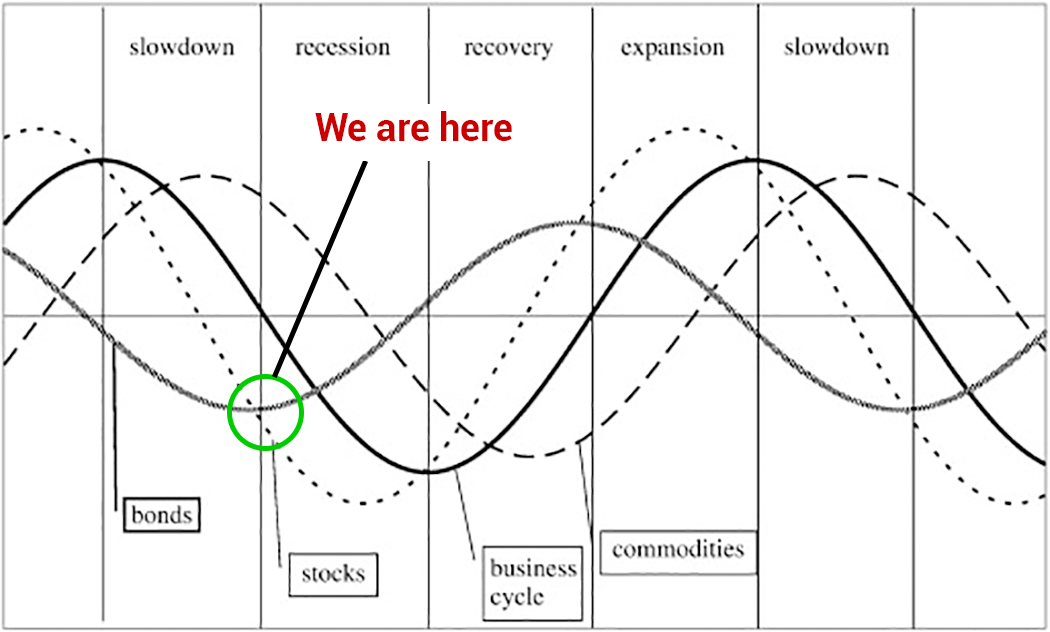
- With the market entering a recession, bonds have upside while stocks and commodities have room to move lower.
Currently, the intermarket business cycle is readily observable by charting the iShares 20+ Year Treasury Bond ETF, Invesco DB Commodity Index ETF (DBC), and the S&P500 (SPX) against each other:
Intermarket Business Cycle (TradingView 7-14-2022)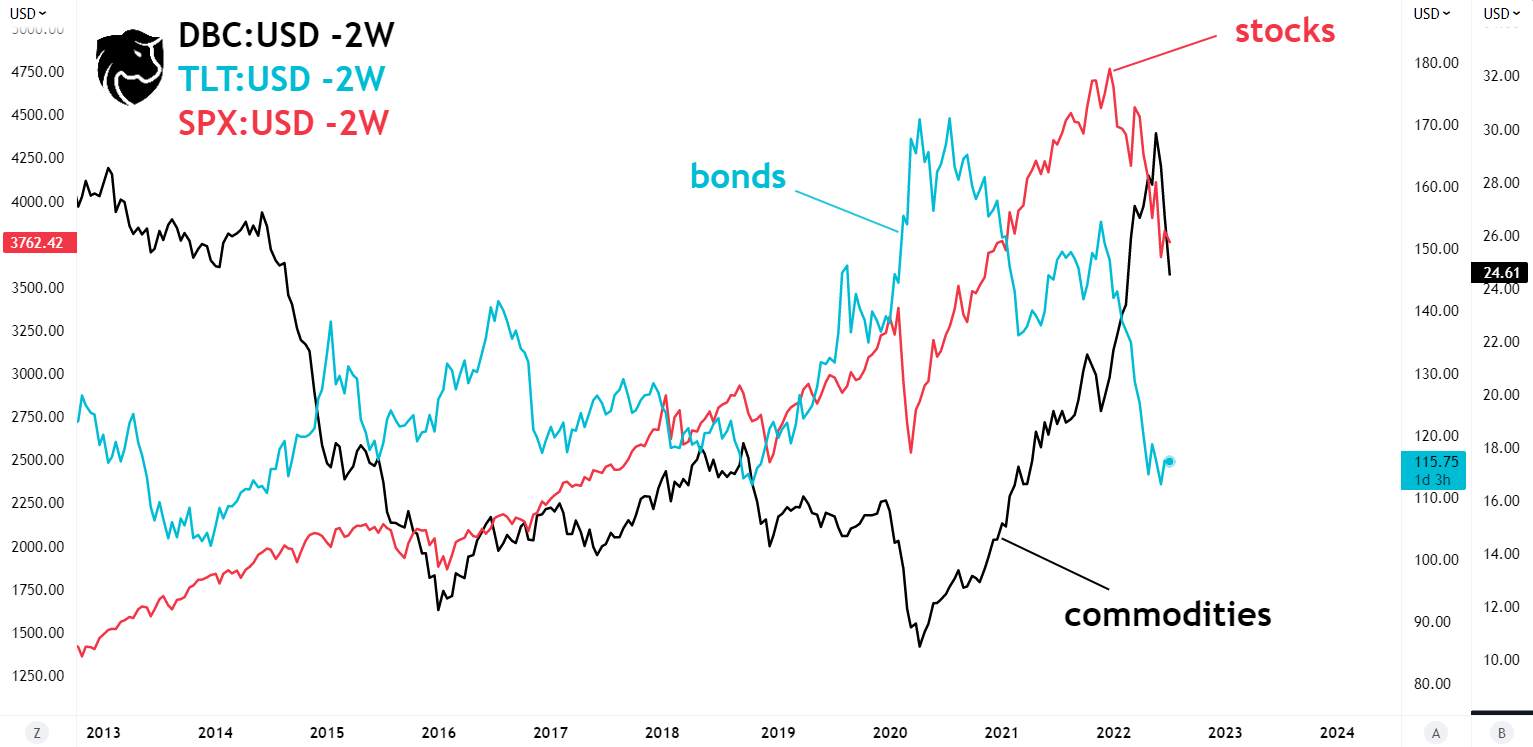
Knowing this, investors can look to cycle back into stocks during the “recovery” phase of the business cycle, i.e., when the recession ends, and bonds begin to roll over. Then later, as the economy enters “expansion” and growth accelerates, commodities again come into favor.
Risk
Our belief that long-duration bonds are bottoming came to fruition after Wednesday’s CPI inflation release. The high inflation print saw TLT move bullish and stocks/commodities move bearish. This price action leads us to believe the market is entering a disinflationary recession, which is bullish for TLT.
The alternate view to our argument is that inflation hasn’t peaked. Those in this camp should look to stay in cash to weather the storm.
Key Takeaway
With the risk of recession rising, long-duration bonds have room for upside while stocks and commodities can move lower.
[ad_2]
Image and article originally from seekingalpha.com. Read the original article here.