
[ad_1]
Updated on July 13th, 2022 by Bob Ciura
Spreadsheet data updated daily
The Wilshire 5000 Total Market Index, or simply the Wilshire 5000 Index, is a market-capitalization-weighted index of all equities that are actively traded in the United States. Because of its depth and breadth, the Wilshire 5000 Index is an excellent place to look for investment opportunities.
With this in mind, we created a free Excel spreadsheet of all Wilshire 5000 stocks.
You can download your list of Wilshire 5000 stocks (along with relevant financial metrics that matter such as dividend yields and price-to-earnings ratios) by clicking on the link below:
Note: Our Wilshire 5000 Stocks List is based on the holdings of the iShares Core S&P Total U.S. Stock Market ETF, which passively tracks the Wilshire 5000 Index.
The Wilshire 5000 Stocks List available for download above contains the following information for every stock in the index:
- Price
- Dividend Yield
- Market Capitalization
- Price-to-Earnings Ratio
Keep reading this article to learn about how to use the Wilshire 5000 stocks list to find investment ideas. We’ll also share other useful resources for self-directed investors.
How To Use The Wilshire 5000 Stocks List To Find Investment Ideas
The volume of stocks contained within the Wilshire 5000 makes the database available in this article a very useful tool to find investment ideas.
This resource becomes even more powerful when combined with a working knowledge of Microsoft Excel.
With that in mind, this tutorial will show you how to implement two useful investing screens to the stocks within the Wilshire 5000 list.
The first screen we’ll apply will be appealing to value investors – it searches for stocks with price-to-earnings ratios below 10 and market capitalizations below $1 billion.
Screen 1: Price-to-Earnings Ratios Below 10 and Market Capitalizations Below $1 Billion
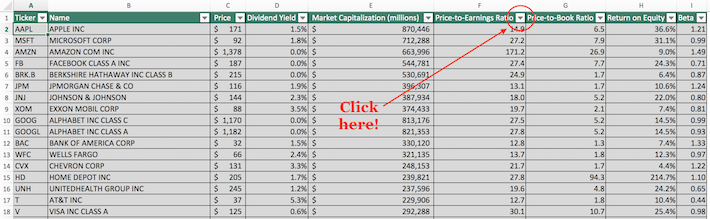
Step 1: Download the Wilshire 5000 stocks list by clicking here.
Step 2: Click on the filter icon at the top of the price-to-earnings ratio column, as shown below.
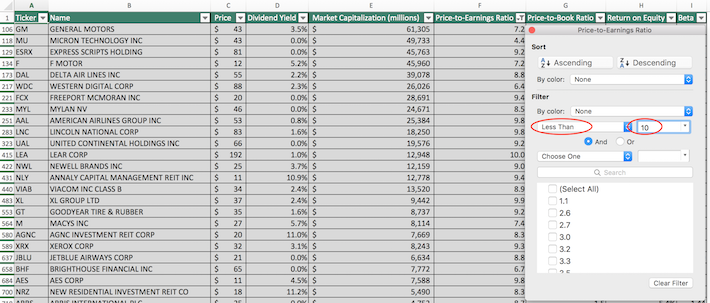
Step 3: Change the filter setting to “Less Than” and input 10 into the field beside it, as shown below. This will filter for stocks within the Wilshire 5000 stocks list with price-to-earnings ratios below 10.
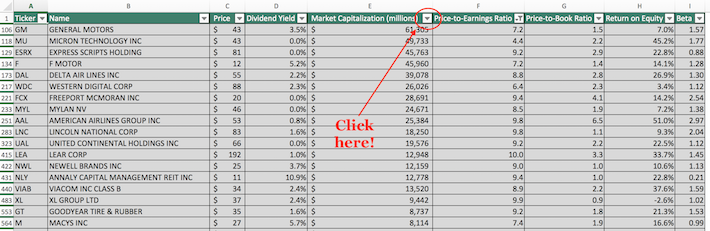
Step 4: Close out of the filter window (by clicking the exit button, not by clicking the “Clear Filter” button in the bottom right corner). Then, click on the filter icon at the top of the market capitalization column, as shown below.
Step 5: Change the filter setting to “Less Than” and input 1000 into the field beside it, as shown below. Since the spreadsheet measures market capitalization in millions of dollars, filtering for stocks with capitalizations below “$1000 million” is equivalent to screening for securities whose market capitalizations are below $1 billion.
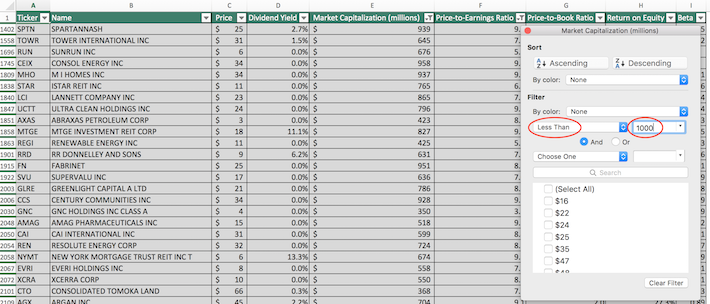
The remaining stocks in this spreadsheet are members of the Wilshire 5000 Index with price-to-earnings ratios below 10 and market capitalizations below $1 billion.
The next screen that we’ll demonstrate will be more appealing to conservative, income-oriented investors: it’s for identifying members of the Wilshire 5000 index with dividend yields above 4% and 5-year betas below 0.6
Screen 2: Dividend Yields Above 4% and Betas Below 0.6
Step 1: Download the Wilshire 5000 stocks list by clicking here.
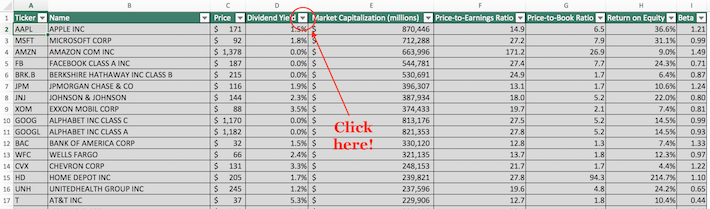
Step 2: Click on the filter icon at the top of the dividend yield column, as shown below.
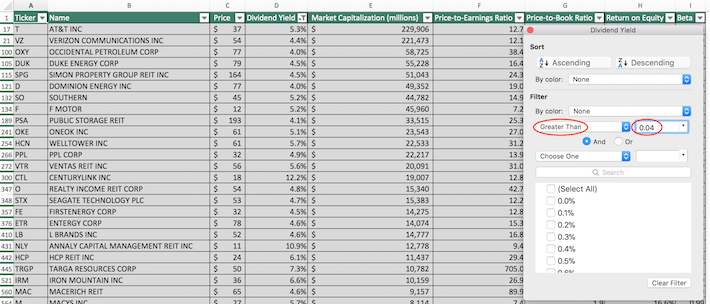
Step 3: Change the filter setting to “Greater Than” and input 0.04 into the field beside it, as shown below. This will filter for constituents of the Wilshire 5000 Index with dividend yields above 4%.
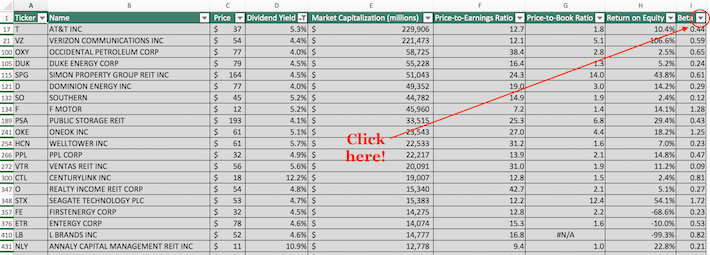
Step 4: Close out of the filter window (by clicking the exit button, not by clicking the “Clear Filter” button in the bottom right corner). Then, click the filter icon at the top of the Beta column, as shown below.
Step 5: Change the filter setting to “Less Than” and input 0.6 into the field beside it, as shown below. This will filter for stocks within the Wilshire 5000 Index with 5-year betas below 0.6.
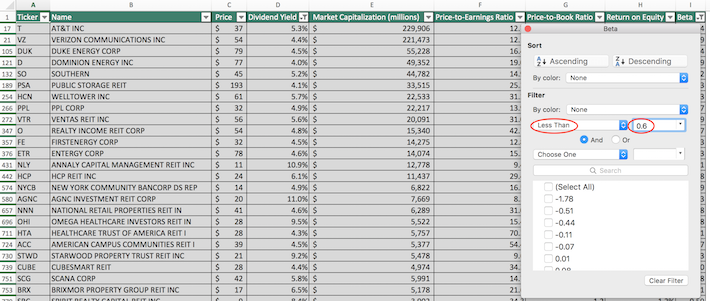
The remaining stocks within this spreadsheet are members of the Wilshire 5000 Index with dividend yields above 4% and 5-year betas below 0.6. These stocks would be suitable for conservative, volatility-averse investors with need for income generation from their investment portfolio.
You now have a solid fundamental understanding of how to use the Wilshire 5000 Stocks List to find investment ideas.
The remainder of this article will describe other useful investing resources that you can use to enhance your due diligence.
Final Thoughts: More Excel-Based Investing Resources
The Wilshire 5000 Index is often referred to as the “total stock market” index because it contains virtually all publicly-traded stocks within the United States. Because of its breadth, however, this index is sometimes not the best resource to use.
If you’re interested in using other domestic stock market indices as a source of investment ideas, the following Sure Dividend database will be useful:
You may also be looking for domestic stocks within a particular sector of the stock market.
If that is the case, you will benefit from knowing about the following Sure Dividend Excel databases:
At Sure Dividend, we often advocate for investing in companies with a high probability of increasing their dividends each and every year.
If that strategy appeals to you, it may be useful to browse through the following databases of dividend growth stocks:
Lastly, Sure Dividend also maintains other databases that classify stocks based on their dividend yields, dividend schedules, corporate histories, and legal structures. The following databases are examples of these:
Thanks for reading this article. Please send any feedback, corrections, or questions to support@suredividend.com.
[ad_2]
Image and article originally from www.suredividend.com. Read the original article here.