[ad_1]
Gold (XAU/USD) Analysis
- Signs of exhaustion appear around the 1800 level
- XAU/USD fails to advance despite a softer dollar after the US CPI print
- Mixed fundamentals complicate the outlook: Geopolitical tensions coupled with unwavering Fed
Signs of Exhaustion Appear Around the 1800 Level
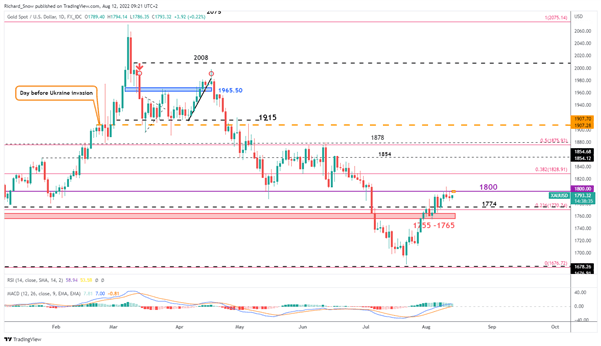
Recent price action for gold has shown multiple failures to trade above the 1800 mark despite numerous tests, which underscores the near-term importance of the psychological whole number of 1800.
The MACD indicator is also showing waning momentum, marking lower highs and lower lows as it approaches the zero mark. Currently, it appears as if gold is attempting another test of 1800 where another failure could add to the idea that gold prices could ease off from here.
Mixed fundamental factors complicate the outlook for gold as the unresolved US-China-Taiwan disputes drag on and could intensify after Nancy Pelosi’s visit to Taiwan. Escalations tend to support gold valuations which could see the precious metal breach the 1800 mark even if it is only temporarily.
Furthermore, it remains unlikely that the Fed will ease up on the rate hiking front despite a cooler July CPI print. Jerome Powell and other prominent FOMC members have alluded to requiring “compelling evidence” that inflation is cooling before pivoting away from aggressive rate hikes. 50 basis points in September appears to be the base case with an outside chance we could still see 75 basis points. All eyes will be on the PCE print on August 26th as this measure of inflation has more influence over the FOMC than CPI.
Higher interest rates combined with lower inflation prints increases real yields and makes the non-yielding yellow metal less appealing.
Gold 4-Hour Chart Showing Possible Exhaustion
Source: TradingView, prepared by Richard Snow
In addition, the post CPI dollar sell-off did little, if anything, to lift gold prices – another possible reason to support the possibility of a pivot at 1800. Resistance is clearly defined at 1800 followed by the 38.2% Fibonacci retracement (1829) of the large 2022 move lower. Support resides at 1774 before 1770 (the 23.6% Fib) and finally the 1755-1765 zone of support.
Gold Daily Chart
Source: TradingView, prepared by Richard Snow
— Written by Richard Snow for DailyFX.com
Contact and follow Richard on Twitter: @RichardSnowFX
[ad_2]
Image and article originally from www.dailyfx.com. Read the original article here.


